The SaaS Metrics That Matter
2021 年 10 月,Craft Ventures 创始合伙人 David Sacks(PayPal Mafia 成员,Yammer 创始人)写下这篇 SaaS 指标精简版——比起 2013 年 Skok 的 7700 词,这篇只有 ~2000 词。但它定义了几个 2021 年才进入主流的概念:Burn Multiple(Sacks 自创)、Magic Number(衡量销售效率)、以及把 NRR、CMGR、DAU/MAU 一起串成 Craft 的 Series A 投资 cheat sheet。Co-authored by Ethan Ruby(Craft's VP of Analytics)。
Craft Ventures 看 SaaS 公司的 8 条标尺
-
SaaS 真正重要的指标就那么几个
"One of the best features of SaaS businesses is how easy they are to measure. Only a handful of metrics really matter."
"This post breaks down those key performance indicators (KPIs), and provides the benchmarks that we at Craft like to see at the Series A stage in order to lead a new investment."
Sacks 把 6 大类 KPI 浓缩成一张可对照的清单:增长 / 留存 / 销售效率 / 毛利 / 资本效率 / 活跃度。
-
Series A 的门槛从 $1M ARR 降到了 $500k
"For startups seeking a Series A funding round, the old benchmark used to be $1 million in ARR. But recently, the threshold has been around $500k ARR, as rounds get preempted and happen earlier."
"Note the requirement that the contract is 'recurring' (ongoing); one-time revenue, such as for professional services or pilots, does not count towards MRR or ARR."
2021 年 SaaS 估值泡沫期 Series A 普遍前置——但 ARR 的定义没变,只有真订阅算数,服务费 / pilot 都不计入。
-
用 CMGR 看增长,不是 Y-o-Y
"Simply looking at month-over-month growth rates is likely to be very lumpy. To normalize for this, use a CAGR calculator but on a monthly basis (h/t Jason Lemkin). This is called Compound Monthly Growth Rate (CMGR)."
"For startups seeking Series A or B funding, we like to see a CMGR of at least 15% below $1M ARR and 10% above $1M ARR. A CMGR of 10% is about 3x year-over-year growth."
月环比波动太大,CMGR(月度复合增长率)能滤掉噪声。1M ARR 之前要 15% / 月,之后 10% / 月——这是"上一个估值溢价"的钱袋子。
-
Net Dollar Retention 比 Logo Retention 重要得多
"The best SaaS companies have 120%+ Dollar Retention each year. Dollar Retention of less than 100% per year is evidence of a Leaky Bucket and is problematic."
"Dollar Retention takes expansion revenue into account, and can be greater than 100% if expansion exceeds churned and contracted revenue… Dollar Retention is much more important than Logo Retention."
120%+ NRR 是顶级 SaaS 的门槛——你不增加任何新客户,收入还会自然往上走 20%。这是估值倍数的最大单一驱动因子。
-
Magic Number > 1 = 销售投入是真有效
"Magic Number is the Net New ARR in a period divided by S&M expense from the prior period. Ideally, the ratio is greater than one."
"It's important to analyze sales efficiency to ensure that growth is efficient and sustainable. 'Fake' growth can always be achieved through uneconomic levels of spending."
花 $1 销售市场,带来 > $1 的 net new ARR 才算合算。低于 1 说明你在贴钱买增长。这个指标 SaaS 圈用了 10 年,Sacks 把它正式放进 cheat sheet。
-
毛利低于 75% 大概率是 Mechanical Turk 公司
"In the long-term, SaaS companies should have a Gross Margin of at least 75%. Persistently low Gross Margins can be evidence of a Mechanical Turk problem, whereby the company is using humans to perform the product capabilities (i.e. it's not a pure software company)."
"There can be good reasons for lower gross margins early in a company's lifecycle, but in the long-term, SaaS companies should have a Gross Margin of at least 75%."
软件公司的边际成本应该接近零;毛利 < 75% 长期持续 = 你的"软件"其实是人在跑。AI 时代这一指标会更严——人工 prompt 标注、人工审核都算。
-
Burn Multiple — Sacks 自创的资本效率铁律
"The Burn Multiple is a company's Net Burn divided by its Net New ARR in a given period. In other words, how much is the startup burning in order to generate each incremental dollar of ARR?"
"For fast-growing SaaS companies, a Burn Multiple of less than one is amazing, but anything less than two is still quite good."
每多挣 $1 ARR 你烧了多少钱?Sacks 用它替代旧的 Hype Ratio(累计融资额 / ARR)——后者看历史,前者看你"最近这一段"在烧得多还是少。< 1 神级,< 2 健康。
-
DAU/MAU 40% 是 SaaS 健康活跃的基准
"A good metric for most SaaS startups is 40% DAU/MAU during non-holiday weekdays, meaning that the typical monthly user visits the site at least two weekdays per week or 8 times per month."
"Once paid, highly engaged accounts are also less likely to churn… SaaS startups may want to remove the noise created by free users. The resulting metric of 'Paid Engagement' would show activity levels for paid seats."
传统上 DAU/MAU 是消费应用的指标——但 SaaS PLG 时代,免费/试用用户的活跃度直接预测了转化和留存。看付费席位的"Paid Engagement"更准。
1. Growth
One of the best features of SaaS businesses is how easy they are to measure.
SaaS 生意最棒的特性之一,就是衡量起来非常容易。
Only a handful of metrics really matter.
真正重要的指标就那么几个。
This post breaks down those key performance indicators (KPIs), and provides the benchmarks that we at Craft like to see at the Series A stage in order to lead a new investment.
本文把这些核心 KPI 拆开讲清楚,并给出我们在 Craft Ventures 领投 Series A 时希望看到的基准值。
We're also releasing our internal tool, SaaSGrid, which we've used to analyze KPIs for hundreds of SaaS companies, as a free publicly-available tool to help founders calculate metrics (anonymously if they wish) for their own startups.
我们同时把内部工具 SaaSGrid 开放出来——这是我们分析过数百家 SaaS 公司 KPI 所用的工具,从今天起免费公开,创始人可以(匿名地)用它来算自家公司的指标。
The starting point for understanding a SaaS business is revenue growth — the best proof of product-market fit.
理解一家 SaaS 公司的起点,是营收增长——这是 product-market fit 最有力的证据。
MRR or ARR: Annual Recurring Revenue (ARR) is the standard for SaaS companies that sell annual subscription contracts, or Monthly Recurring Revenue (MRR) for those selling monthly subscriptions.
MRR 还是 ARR:卖年度订阅的 SaaS 公司用 ARR(Annual Recurring Revenue,年度经常性收入)作为标准,卖月度订阅的用 MRR(Monthly Recurring Revenue,月度经常性收入)。
If your company sells both, choose the metric that represents the majority of revenue.
如果两种都卖,选占大头的那个作为核心指标。
ARR is always 12 x MRR.
ARR 永远等于 12 × MRR。
Note the requirement that the contract is "recurring" (ongoing); one-time revenue, such as for professional services or pilots, does not count towards MRR or ARR.
注意"recurring"的关键含义:必须是持续性的合同;一次性收入——比如专业服务费、pilot 项目费——不算 MRR 或 ARR。
For startups seeking a Series A funding round, the old benchmark used to be $1 million in ARR.
想拿 Series A 的创业公司,旧门槛是 $1M ARR。
But recently, the threshold has been around $500k ARR, as rounds get preempted and happen earlier.
但最近这个门槛已经降到了 $500k ARR 左右——融资轮被前置、提前发生。
CMGR: What's the best way to measure growth in MRR?
CMGR:衡量 MRR 增长最好的办法是什么?
Simply looking at month-over-month growth rates is likely to be very lumpy.
单纯看月环比增长率,数据通常波动很大。
To normalize for this, use a CAGR calculator but on a monthly basis (h/t Jason Lemkin).
为了把这个波动平滑掉,用 CAGR 计算器但按月计算(感谢 Jason Lemkin)。
This is called Compound Monthly Growth Rate (CMGR).
这叫 CMGR(Compound Monthly Growth Rate,月度复合增长率)。
For example, if you began the year at $100k ARR and ended at $1M ARR, you would enter those starting and ending values over 12 periods, for a CMGR of 21%, an outstanding result.
举例:年初 $100k ARR,年底 $1M ARR——把起止值带入 12 个周期的 CAGR 公式,得到 21% CMGR——这是非常出色的结果。
For startups seeking Series A or B funding, we like to see a CMGR of at least 15% below $1M ARR and 10% above $1M ARR.
想拿 Series A 或 B 的公司,我们希望看到的标准是:$1M ARR 以下 CMGR 至少 15%,$1M 以上至少 10%。
A CMGR of 10% is about 3x year-over-year growth.
10% CMGR 大约等于年同比 3 倍增长。
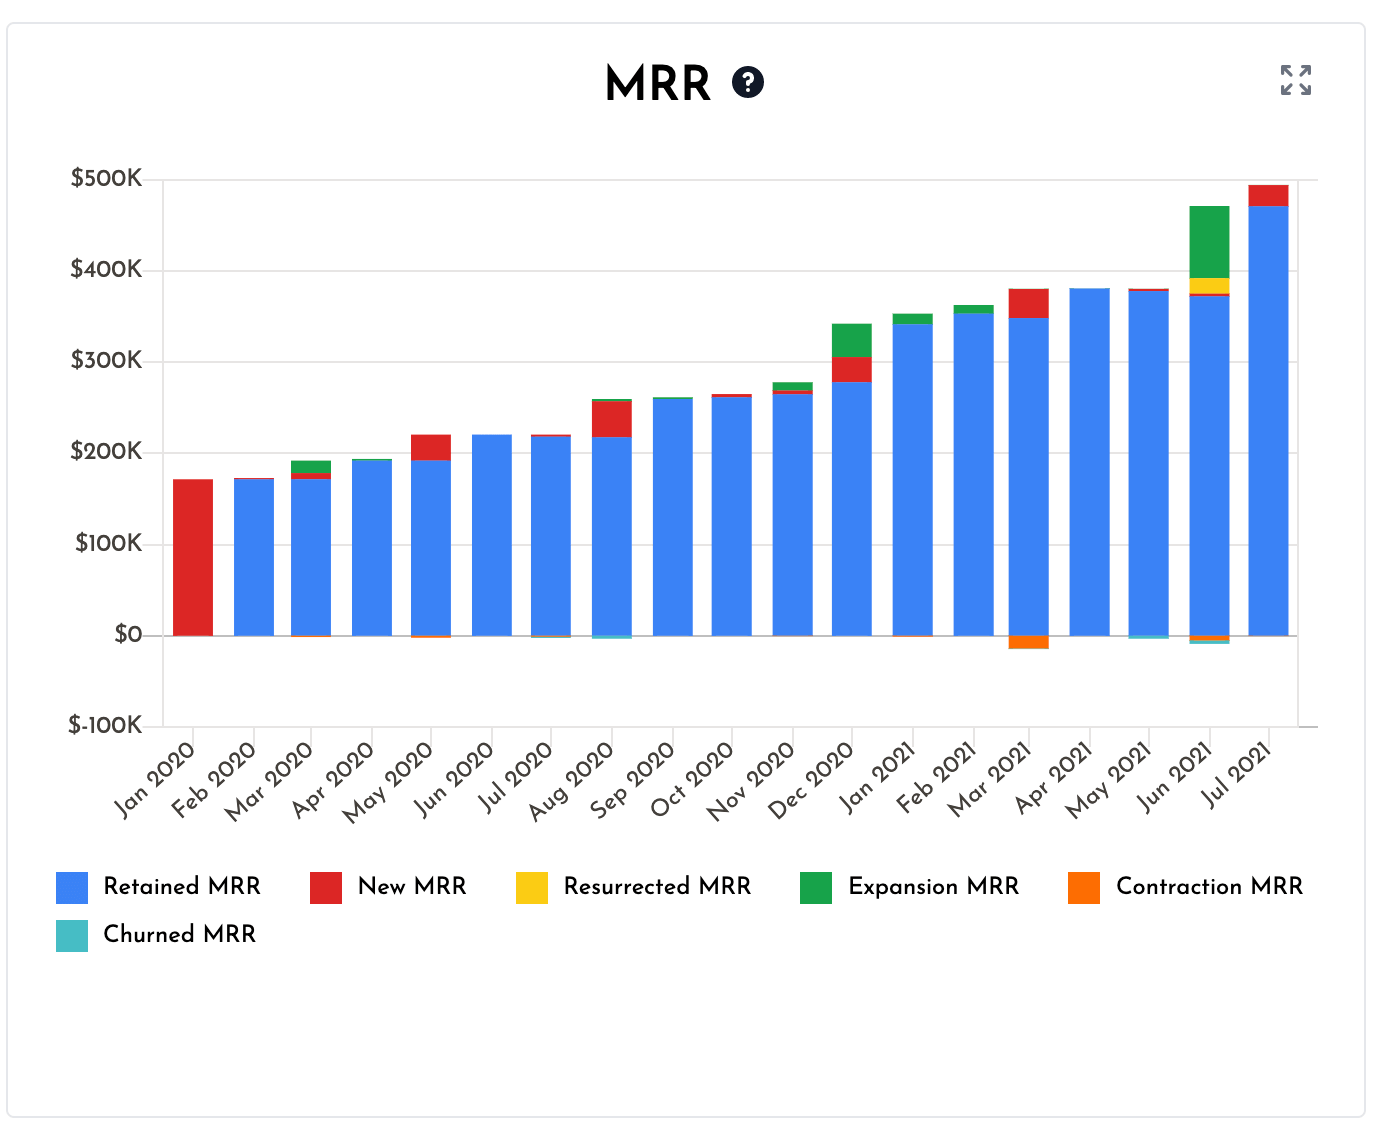
MRR Components: Breaking down MRR into its key components helps to understand changes in MRR over time.
MRR 分量:把 MRR 拆成几个核心分量,你才能看清它随时间怎么变化。
For any given period, we want to understand the contribution of the following:
任何一个周期里,我们都想看清以下六个分量分别贡献了多少:
· Retained — MRR retained from existing customers
· Expansion — MRR added from existing customers
· New Sales — MRR added from new customers
· Resurrected — MRR added from former customers
· Contraction — MRR lost from customer downgrades
· Churned — MRR lost from churned customers
· Retained(保留)—— 来自存量客户的留存 MRR
· Expansion(扩展)—— 存量客户扩容/升级带来的 MRR
· New Sales(新签)—— 新客户带来的 MRR
· Resurrected(回流)—— 流失后又回来的老客户贡献的 MRR
· Contraction(收缩)—— 客户降级造成的 MRR 损失
· Churned(流失)—— 客户取消造成的 MRR 损失
Customer Concentration: Is growth being driven by a few big contracts or many small ones?
客户集中度:增长来自少数大单还是大量小单?
It's a potential red flag if too much revenue is concentrated in too few large accounts.
如果收入太集中在少数大客户身上,这是一个潜在红旗。
If one or two customers make up the majority of revenue, that's a significant risk to the business that needs to be vetted.
如果一两个客户就占了收入的大头,这是个需要审视的重大风险。
On the other hand, if the largest customer is less than 10% of revenue, that's generally a healthy sign.
反过来,如果最大客户占比 < 10%,那通常是健康信号。
2. Retention
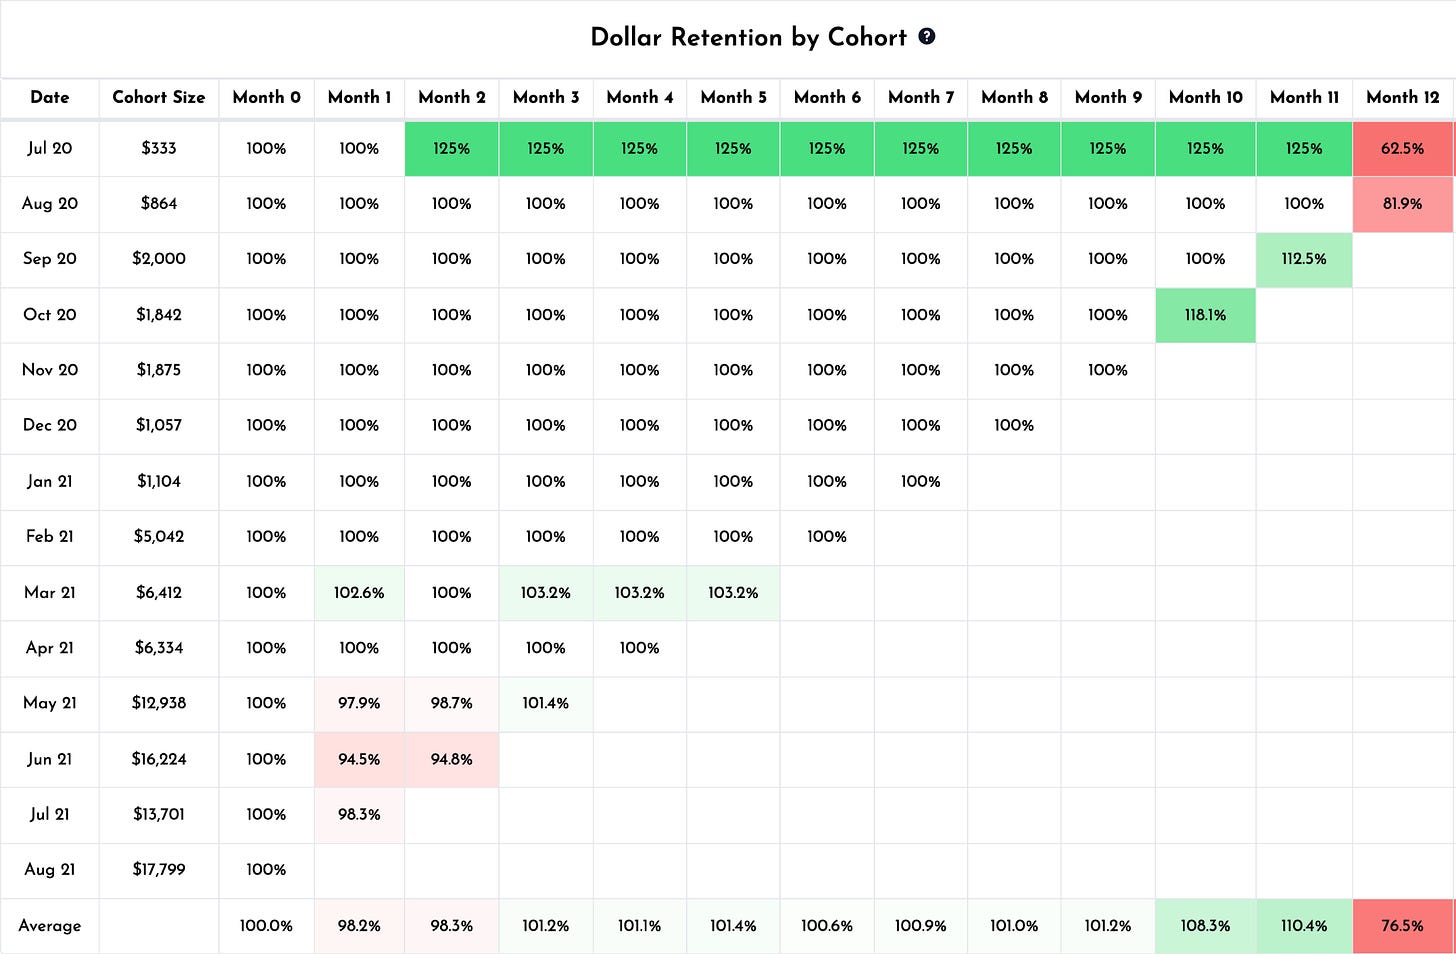
Retention is analyzed by grouping customers into "cohorts" according to their sign-up period (month, quarter or year), then tracking what percentage of the original cohort remains over time.
分析留存的办法是:按入组时间(月、季、年)把客户分成 cohort,然后追踪每个 cohort 随时间还剩多少。
Understanding retention rates of monthly cohorts, typically at months 12 and 24, is vital to the health of the business, as a fast growth rate in new signups can mask high churn rates in older, smaller cohorts.
看清月度 cohort 在第 12 个月和第 24 个月的留存率,对生意的健康度至关重要——因为新增客户的高速增长会掩盖老 cohort 的高流失率。
Only when growth slows down will this "leaky bucket" become obvious.
只有当增长慢下来时,这个"漏底的桶"才会显露出来。
There are two main ways to analyze retention:
分析留存有两种主要方法:
Dollar Retention: Also known as Net Revenue Retention (NRR), Dollar Retention measures how much revenue a cohort is generating in each period relative to its original size.
Dollar Retention(收入留存):也叫 NRR(Net Revenue Retention,净收入留存)。它衡量一个 cohort 当前贡献的收入相对于初始规模的比值。
Dollar Retention takes expansion revenue into account, and can be greater than 100% if expansion exceeds churned and contracted revenue.
Dollar Retention 把扩展收入也算进去,所以当扩展 > 流失 + 收缩时,这个数可以大于 100%。
The best SaaS companies have 120%+ Dollar Retention each year.
最好的 SaaS 公司每年的 Dollar Retention 在 120% 以上。
Dollar Retention of less than 100% per year is evidence of a Leaky Bucket and is problematic.
如果年度 Dollar Retention < 100%,这就是"漏底的桶"的证据,有问题。
Logo Retention: Logo Retention measures the percent of customers that stay active (non-churned).
Logo Retention(客户数留存):衡量有多少比例的客户保持活跃(没流失)。
Logo Retention can never be higher than 100% since the number of logos can't expand.
Logo Retention 永远不会高于 100%——因为客户数只会减少不会增加。
As a result, Logo Retention is usually much lower than Dollar Retention.
因此 Logo Retention 通常比 Dollar Retention 低很多。
Logo Retention is typically a function of customer size: 90-95% is common for enterprises, 85% for mid-market, and 70-80% for small businesses.
Logo Retention 通常跟客户规模强相关:企业客户 90-95% 是常见的,中等市场 85%,SMB 70-80%。
Logo Retention below these benchmarks could be evidence of a problem.
低于这些基准就可能是出问题的信号。
That said, Dollar Retention is much more important than Logo Retention.
话虽如此,Dollar Retention 比 Logo Retention 重要得多。
3. Sales Efficiency / Unit Economics
It's important to analyze sales efficiency to ensure that growth is efficient and sustainable.
分析销售效率,是为了确保增长既高效又可持续。
"Fake" growth can always be achieved through uneconomic levels of spending.
用不计成本的烧钱,你随时都能造出"虚假"的增长。
Several related metrics help to understand sales efficiency by comparing the value of new customers to the cost of acquiring them:
几个相互关联的指标,通过对比"新客户带来的价值"与"获取他们的成本",来帮你看清销售效率:
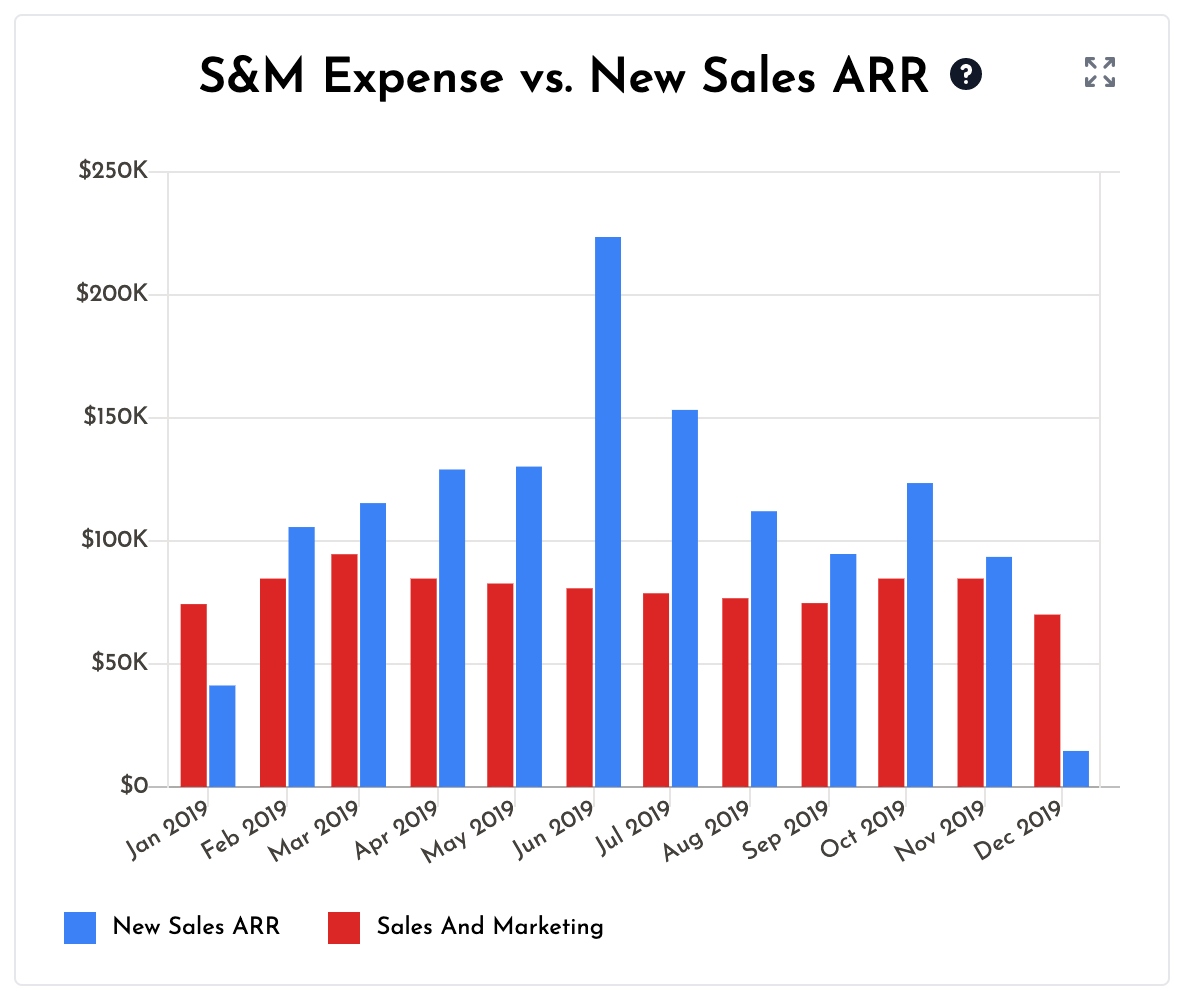
New Sales ARR vs S&M Expense: How much did the Sales & Marketing (S&M) departments (inclusive of all programs and personnel) spend compared to how much New Sales ARR (ARR from new customers only) was added in the same period?
新签 ARR vs 销售市场支出:同一个周期里,销售 & 市场部门(包括所有项目和人员)花了多少钱,相比之下新增了多少 New Sales ARR(仅来自新客户的 ARR)?
Ideally, New Sales ARR is equal to or greater than S&M spending.
理想情况是:New Sales ARR ≥ S&M 支出。
CAC: Customer Acquisition Cost (CAC) divides S&M expense in the preceding period (month or quarter) by the number of new customers in the current period.
CAC:客户获取成本 = 上一期(月或季)的 S&M 支出 ÷ 当前期的新客户数。
The lag is intended to reflect the time it takes for S&M investment to materialize in new sales.
为什么要错开一期?因为 S&M 投入要过一段时间才会兑现为新签。
Longer or shorter lag may be appropriate depending on the length of the sales cycle.
具体错几期取决于你的销售周期长短。
New ACV vs CAC: It's useful to compare Annual Contract Value (ACV) of new customers to their CAC.
新客 ACV vs CAC:把新客户的 ACV(Annual Contract Value,年合同价值)跟 CAC 做对比很有用。
Ideally, ACV is greater than CAC, meaning that customer acquisition does not cost more than first year's revenue.
理想情况:ACV > CAC——也就是说,你获取一个客户的成本不该超过他第一年的收入。
CAC Payback: To determine how many months it takes for a customer to produce enough gross profit to pay back its CAC, divide S&M spend by MRR x Gross Margin.
CAC 回收期:计算"一个客户的毛利累计多少个月能覆盖他的 CAC"——公式是 S&M 支出 ÷ (MRR × 毛利率)。
Lower margin products with high CAC do poorly on payback.
毛利低、CAC 高的产品,在回收期这一项上表现差。
Magic Number: Magic Number is the Net New ARR in a period divided by S&M expense from the prior period.
Magic Number:本期 Net New ARR ÷ 上一期的 S&M 支出。
Ideally, the ratio is greater than one.
理想情况下这个比值 > 1。
4. Margins
Gross Margin: Gross Margin reflects a company's margin after subtracting the cost of goods sold (COGS) from revenue.
Gross Margin(毛利率):从收入中扣除 COGS(Cost of Goods Sold,销货成本)之后的利润率。
For SaaS companies, COGS typically consist of hosting costs, any data or software needed for the product to operate, and the cost of frontline operations.
对 SaaS 公司来说,COGS 通常包括托管费、产品运行所需的数据/软件,以及一线运营的人力成本。
There can be good reasons for lower gross margins early in a company's lifecycle, but in the long-term, SaaS companies should have a Gross Margin of at least 75%.
公司早期毛利低可能有正当原因——但长期来看,SaaS 公司毛利率应当至少达到 75%。
Persistently low Gross Margins can be evidence of a Mechanical Turk problem, whereby the company is using humans to perform the product capabilities (i.e. it's not a pure software company).
毛利长期低可能暗示一个"Mechanical Turk(人肉机)"问题:公司其实是在用人来跑产品的能力——也就是说,它不是一家纯粹的软件公司。
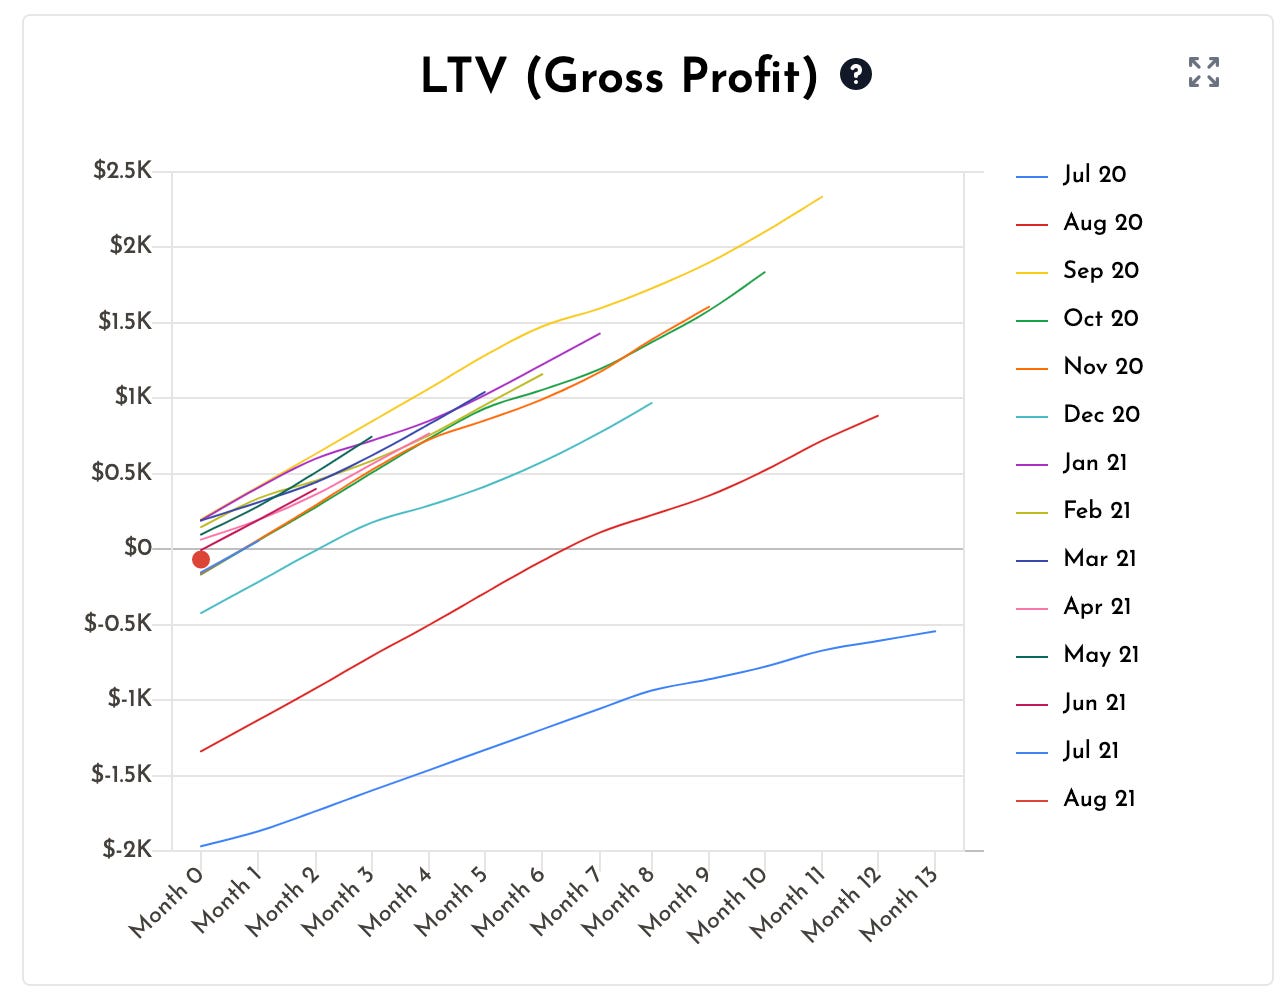
LTV: Lifetime Value (LTV) is the cumulative gross profit contribution, net of CAC, of the average customer in a cohort.
LTV:Lifetime Value——一个 cohort 中平均客户的累计毛利贡献减去 CAC。
Therefore, LTV incorporates CAC, Dollar Retention, and Gross Margin to show overall company health.
因此 LTV 把 CAC、Dollar Retention 和毛利率都揉到了一起,反映公司整体健康度。
If Dollar Retention is greater than 100%, LTV can increase indefinitely.
如果 Dollar Retention > 100%,LTV 可以无限增长。
However, if customers churn, LTV will flatten out and stop increasing.
但如果客户流失,LTV 就会走平、停止增长。
Healthy cohorts cross the $0 LTV line before month 12, and LTV grows to at least 3x original CAC over time.
健康的 cohort 会在第 12 个月之前跨过 $0 LTV 线——并且随着时间推移,LTV 增长到至少 3 × 初始 CAC。
5. Capital Efficiency
Burn Multiple: The Burn Multiple is a company's Net Burn divided by its Net New ARR in a given period (typically annually or quarterly).
Burn Multiple(烧钱倍数):= 给定周期(通常按年或按季)内的 Net Burn(净烧钱) ÷ 同期 Net New ARR。
This formula evaluates burn as a multiple of ARR growth.
这个公式用 ARR 增长为基准来评价烧钱。
In other words, how much is the startup burning in order to generate each incremental dollar of ARR?
换句话说:每多挣 1 美元的 ARR,公司烧了多少钱?
The higher the Burn Multiple, the more the startup is burning to achieve each unit of growth.
Burn Multiple 越高,意味着每单位增长要烧掉的钱越多。
The lower the Burn Multiple, the more efficient the growth is.
Burn Multiple 越低,增长越高效。
For fast-growing SaaS companies, a Burn Multiple of less than one is amazing, but anything less than two is still quite good.
高速增长的 SaaS 公司里,Burn Multiple < 1 是惊艳水平,< 2 也仍然相当不错。
If a startup has a high Burn Multiple but low CAC, that could indicate that S&M costs have been miscategorized.
如果一家创业公司 Burn Multiple 很高但 CAC 很低,这可能意味着 S&M 的成本被错分类(藏到别的科目里去了)。
Hype Ratio: Another popular way to measure capital efficiency is the Hype Ratio, which equals Capital Raised (or Burned) divided by ARR.
Hype Ratio:另一个常用的资本效率指标是 Hype Ratio——等于累计融资额(或累计烧钱)÷ ARR。
But we prefer Burn Multiple because it focuses on recent performance.
但我们更喜欢 Burn Multiple,因为它聚焦在"最近的表现",而不是历史累积。
6. Engagement
Traditionally a consumer metric, user engagement has taken on new relevance for SaaS startups, as free trials or freemium users are more likely to convert to paid accounts when they have high engagement.
活跃度过去主要是消费应用的指标——但对 SaaS 创业公司,它有了新的意义:免费试用或 freemium 用户,只有活跃度高时才更可能转化为付费账户。
Once paid, highly engaged accounts are also less likely to churn.
付费之后,活跃度高的账户也更不容易流失。
There are two main measures of engagement:
衡量活跃度主要有两种指标:
DAU/MAU: The ratio of daily active users to monthly active users.
DAU/MAU:日活用户 / 月活用户的比值。
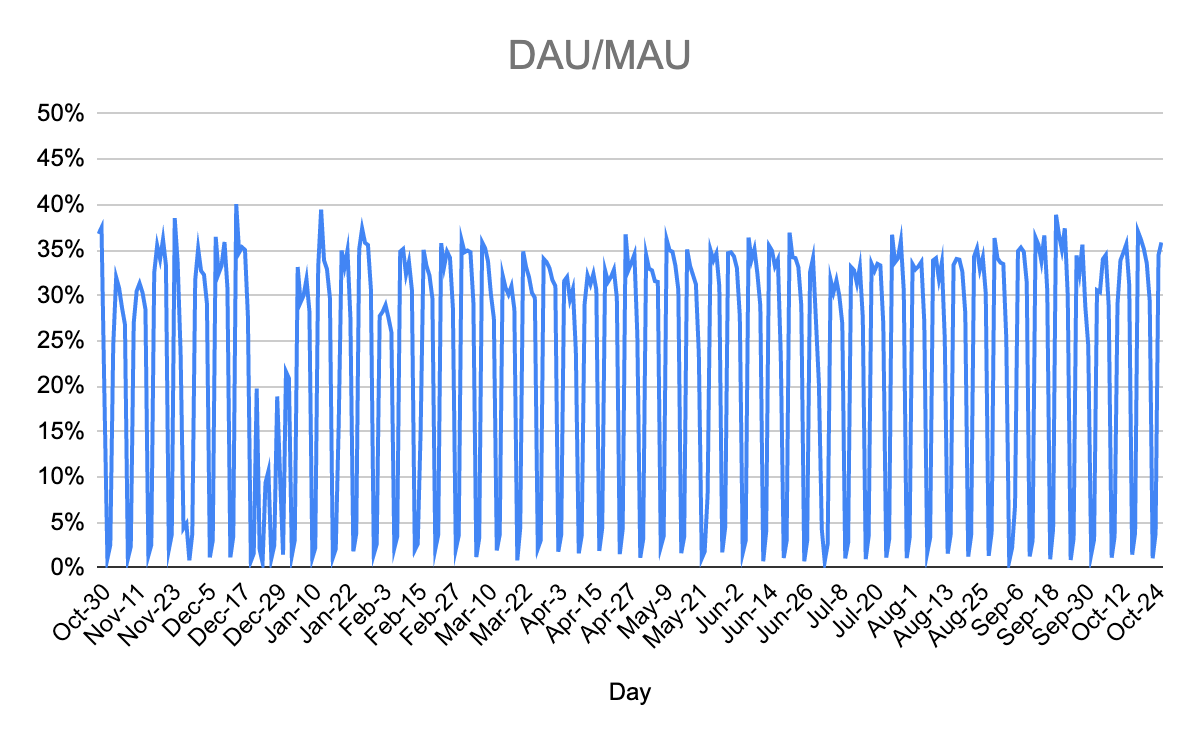
A good metric for most SaaS startups is 40% DAU/MAU during non-holiday weekdays, meaning that the typical monthly user visits the site at least two weekdays per week or 8 times per month.
对大多数 SaaS 创业公司,非节假日工作日 40% DAU/MAU 是一个不错的标准——意味着典型的月活用户每周至少有两个工作日来访,即每月 8 次。
In general, you can see the non-holiday weekday usage by eyeballing the crests of the chart:
一般来说,你可以从图表的"波峰"目测非节假日工作日的使用情况:
DAU/WAU: The ratio of daily active users to weekly active users.
DAU/WAU:日活用户 / 周活用户的比值。
A good metric for most SaaS startups is 60% DAU/WAU during non-holiday weekdays, meaning that the typical weekly user visits the site 3 out of 5 weekdays.
对大多数 SaaS 创业公司,非节假日工作日 60% DAU/WAU 是不错的标准——意味着典型的周活用户每周 5 个工作日里来 3 天。
In both cases, SaaS startups may want to remove the noise created by free users.
这两种情况下,SaaS 公司可能都想去掉免费用户带来的噪音。
The resulting metric of "Paid Engagement" would show activity levels for paid seats.
由此产生的"Paid Engagement(付费活跃度)"只看付费席位的活跃度——更能反映真实情况。
Introducing SaaSGrid & 24-Hour Guarantee
Introducing SaaSGrid
At Craft, we analyze these metrics for every SaaS investment we consider.
在 Craft,我们考察每一个 SaaS 投资标的时,都会跑这些指标。
SaaSGrid helps us do this efficiently, and identify startups with the very best growth, retention, and economics.
SaaSGrid 让我们能高效地完成这件事——快速识别出那些在增长、留存和经济学三方面都是顶级的创业公司。
We're now excited to now make SaaSGrid public and free to use.
我们很高兴现在把 SaaSGrid 公开,免费给所有人用。
With SaaSGrid, founders can anonymously enter their MRR data and a few lines from their P&L, and instantly get a beautiful dashboard with the metrics and benchmarks above.
用 SaaSGrid,创始人可以匿名地填入自己的 MRR 数据和 P&L 中的几行,瞬间就能得到一张包含上述指标和基准的精美 Dashboard。
Our hope is that founders can use this tool to evaluate the health of their business, assess their readiness for fundraising, and easily share their metrics with advisors and investors.
我们希望创始人能用这个工具评估自家生意的健康度、评估融资准备情况,并轻松地把这些指标分享给 advisor 和投资人。
24-Hour Guarantee
If you send us your metrics already formatted in SaaSGrid, Craft Ventures can tell you whether we're interested within one business day.
如果你用 SaaSGrid 把指标格式化好之后发给我们,Craft Ventures 会在一个工作日内告诉你我们是否感兴趣。
Just email a link to your SaaSGrid dashboard to saasgrid@craftventures.com.
只要把你 SaaSGrid Dashboard 的链接发邮件到 saasgrid@craftventures.com 即可。
We look forward to seeing your SaaSGrids!
期待看到你的 SaaSGrid!
This post was co-authored by Ethan Ruby, Craft's Vice President of Analytics.
本文与 Ethan Ruby(Craft 数据分析副总裁)合著。