SaaS Metrics 2.0
2013 年 1 月 16 日,Matrix Partners 的 David Skok 把这篇 7700 词的"SaaS 指标 2.0"放上 forentrepreneurs.com。十几年过去,这篇文章被引用过的数字大概比这个站本身的访客还多——LTV:CAC > 3、Months to Recover CAC < 12、Negative Churn 三个"行规"都来自这里。本文按句对照重译,保留所有 24 张原图。
SaaS 真正能用的 12 条核心判断
-
SaaS 跟传统软件的根本差异:订阅模式
"SaaS, and other recurring revenue businesses are different because the revenue for the service comes over an extended period of time."
"If customers are happy with the service, they will stick around for a long time, and the profit that can be made from that customer will increase considerably."
收入摊在合同期内分笔到账,获客成本却在第一天全部花掉——这一不对称是后面所有指标的源头。
-
增长越快,现金流坑越深
"SaaS businesses face significant losses in the early years (and often an associated cash flow problem). This is because they have to invest heavily upfront to acquire the customer, but recover the profits from that investment over a long period of time."
"If we experience a cash flow trough for one customer, then what will happen if we start to scale the business and acquire many more customers at the same time? The answer is that the cash flow trough gets deeper, and takes longer."
把油门踩到底之前先想清楚现金——五个月增一个客户和五个月每月增一个客户,前者赚钱后者烧钱,曲线翻面要 24 个月。
-
三件事:获客、留存、变现——留存第一
"The 3 Keys to Success in SaaS: 1) Acquiring Customers 2) Retaining Customers 3) Monetizing Customers."
"If you can't keep your customers happy, and keep them using the service, there is no point in worrying acquiring more of them. You will simply be filling a leaky bucket."
顺序很关键——先把桶补上再往里加水。早期 Churn 看着不痛,过了 ARR ramp 之后每月都在抵消新增。
-
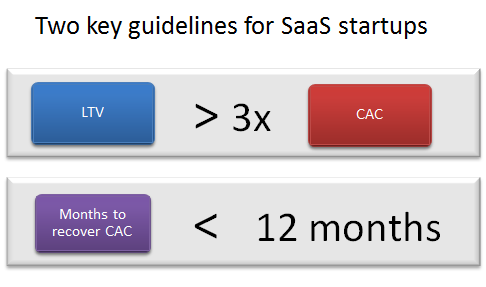
两条铁律:LTV/CAC > 3、Months to Recover CAC < 12
"LTV should be greater than 3 x CAC for a viable SaaS or other form of recurring revenue model. Better SaaS businesses get to a multiple of 5x or higher."
"Months to recover CAC should be less than 12 months. Companies that are well funded with strong balance sheets can stretch this number, but for most companies, this 12 month threshold is critical."
不到 3 倍说明商业模式不成立;超过 12 个月回本说明你在补贴增长——只有钱多得花不完才能扛得住。
-
ARR(年付)和 MRR(月付)是两种生意
"Those with primarily monthly contracts… The key SaaS metric is MRR. Those with primarily annual contracts… The key SaaS metric is ARR."
"Most of the time in this article, I will refer to ARR. This means use MRR if you are the first kind of business, and ARR if you are the second."
不要混着记。月付公司看 MRR,年付公司看 ARR——核心 KPI 的颗粒度跟合同结构对齐。
-
Bookings = 新增 + 流失 + 扩展,三个数缺一不可
"Net New ARR = New ARR + Churned ARR (always a negative number) + Expansion ARR."
"The sum of all three of these makes up your Net ARR or MRR Bookings… This chart shows the three components of ARR Bookings, and the Net New ARR (or MRR) Bookings, which is what really counts."
单看 New 会让你乐观,单看 Net 又看不清问题出在哪。三个分量分开看才知道是签单瓶颈、流失问题,还是 expansion 没跑起来。
-
小公司不用怕 Churn,中等规模的会被 Churn 杀死
"In the early days of a SaaS business, churn really doesn't matter that much. But over time, no matter how successful your sales team is at growing the business, the absolute number of churned customers will grow to a point where it cancels out new business."
"Once you start scaling, churn is one of those things that can really hurt your business if it is not addressed early."
100 个客户 3% 流失 = 一个月丢 3 个,签 5 个就净增 2 个,没事。10000 个客户 3% 流失 = 一个月丢 300 个,你签得过来吗?
-
Negative Churn 是 SaaS 的圣杯
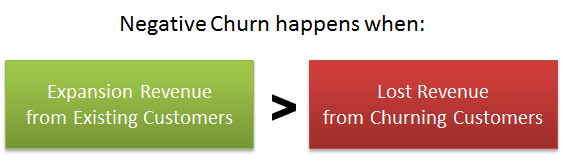
"The ultimate solution to the churn problem is to get to Negative Churn. This is where the expansion revenue that you get from your existing customers in any month/year, exceeds the revenue that you lose from churn."
"In the bottom graph, we're losing the same 3%, but adding 5% extra revenue per month from our existing customers. You can see how dramatic the difference is to the business' growth potential."
现有客户每月扩容 5% > 流失 3%,你不用拉新都在自动长。前提是定价有可变维度(座位数、用量、模块),或者能 upsell。
-
Engagement Score:在客户流失之前就能看见
"Since churn is so important, wouldn't it be useful if we could predict in advance which customers are most likely to churn?"
"At HubSpot we had a lot of success looking at this metric – we called in Customer Happiness Index (CHI). Customers with low CHI scores were our most likely candidates for churn."
流失是个 lagging 指标,等你看到 cancel 时已经晚了。建一个 leading 指标(登录频率、用了几个核心功能、活跃人数占席位数比例)能提前 30-90 天看到。
-
Cohort Analysis 才是 Churn 的真显微镜
"This can help answer questions such as: Are we losing most of the customers in the first couple of months? Does Churn stabilize after a while? Are there ways to identify customers that are going to leave?"
"A cohort is simply a fancy name for a group. In SaaS businesses, we usually group customers by the month they signed up… and follow that group over time."
总流失率藏着结构信息——是新客户头三月翻车,还是熟客逐渐流失?这两种问题的修法完全不同。看 cohort 才能区分。
-
分层:不是所有客户都一样赚钱,加倍下注高 LTV/CAC 段
"At HubSpot, we started to see some of our biggest improvements in unit economics when we started segmenting our business and calculating the LTV to CAC ratio for each of our personas and go to market strategies."
"We had 12 reps selling directly into the VSB market and 4 reps selling through Value Added Resellers (VARs). When we looked at the math we realized we had a LTV:CAC ratio of 1.5 selling direct, and a LTV:CAC ratio of 5 selling through the channel. The solution was obvious."
同一段客户,直销 LTV/CAC 1.5,渠道 LTV/CAC 5——12 个月后他们把 12 个直销 rep 砍到 2 个,渠道 rep 从 4 个扩到 25 个。同一家公司,两套经济学。
-
SaaS 的决策窗口是 9-12 个月,提前规划是硬约束
"If you are not happy with your current growth rate, it will often take nine to twelve months from the point of decision before the growth resulting from increased investment in sales and marketing will actually be observed."
"It takes time for most initiatives to have an impact. We've learned from some tough lessons that planning has to be done well in advance to drive a SaaS business."
SaaS 不像电商,你今天加投放明天看效果。今天决定加销售,要等他 ramp,要等他签的客户兑现 ARR,合计 9-12 月——所以"等不行了再调"必然来不及。
What's so different about SaaS?
SaaS, and other recurring revenue businesses are different because the revenue for the service comes over an extended period of time (the customer lifetime).
SaaS——以及其他订阅型生意——之所以不一样,是因为服务的收入会摊在一个很长的时间窗口里(也就是客户的"生命周期")才陆续到账。
If a customer is happy with the service, they will stick around for a long time, and the profit that can be made from that customer will increase considerably.
如果客户对服务满意,就会留下来很久,你能从这个客户身上挣到的利润会随时间显著放大。
On the other hand if a customer is unhappy, they will churn quickly, and the business will likely lose money on the investment that they made to acquire that customer.
反过来,如果客户不满意,会很快流失,而你为获取这个客户付出的投入很可能血本无归。
This creates a fundamentally different dynamic to a traditional software business: there are now two sales that have to be accomplished:
这就跟传统软件生意有了根本性的不同——你现在需要完成的是两次"销售":
1. Acquiring the customer
2. Keeping the customer (to maximize the lifetime value).
1. 获取客户
2. 留住客户(才能把生命周期价值做到最大)。
Because of the importance of customer retention, we will see a lot of focus on metrics that help us understand retention and churn.
正因为留存如此关键,本文会花大量篇幅在那些帮你看清留存和流失情况的指标上。
But first let's look at metrics that help you understand if your SaaS business is financially viable.
但在那之前,我们先看一组能帮你判断"这个 SaaS 生意财务上跑不跑得通"的指标。
2) Retaining Customers / 留住客户
3) Monetizing Customers / 持续变现
The SaaS P&L / Cash Flow Trough
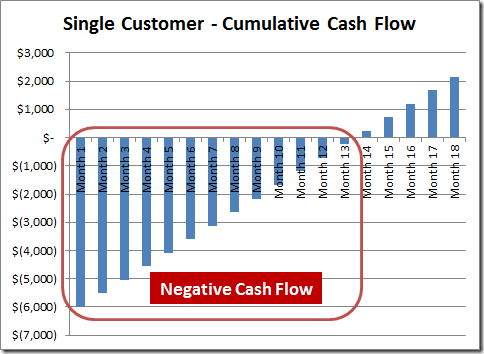
SaaS businesses face significant losses in the early years (and often an associated cash flow problem).
SaaS 公司在前几年通常会出现可观的亏损,以及随之而来的现金流问题。
This is because they have to invest heavily upfront to acquire the customer, but recover the profits from that investment over a long period of time.
原因是:获取一个客户的钱要在第一天就花出去,但这笔投入产生的利润要分摊到很长的时间窗口才能回收。
The faster the business decides to grow, the worse the losses become.
生意增长得越快,亏损就越严重。
Many investors/board members have a problem understanding this, and want to hit the brakes at precisely the moment when they should be hitting the accelerator.
很多投资人和董事会成员理解不了这一点——他们会在你应该踩油门的时刻让你踩刹车。
In many SaaS businesses, this also translates into a cash flow problem, as they may only be able to get the customer to pay them month by month.
在很多 SaaS 公司里这同时也是个现金流问题——因为客户可能只愿意按月付款。
To illustrate the problem, we built a simple Excel model which can be found here.
为了把这个问题讲清楚,我们做了一个简单的 Excel 模型,在这里。
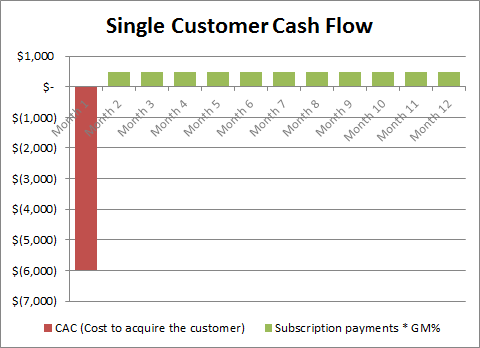
In that model, we are spending $6,000 to acquire the customer, and billing them at the rate of $500 per month.
这个模型里我们假设:获取一个客户花 $6,000,客户每月付 $500。
Take a look at these two graphs from that model:
看一下从这个模型出来的两张图:
If we experience a cash flow trough for one customer, then what will happen if we start to do really well and acquire many customers at the same time?
如果一个客户都会让你出现现金流低谷,那当生意做起来、同时签下很多客户时会怎样?
The model shows that the P&L/cash flow trough gets deeper if we increase the growth rate for the bookings.
模型告诉你:增长越快,P&L 和现金流的低谷就越深。
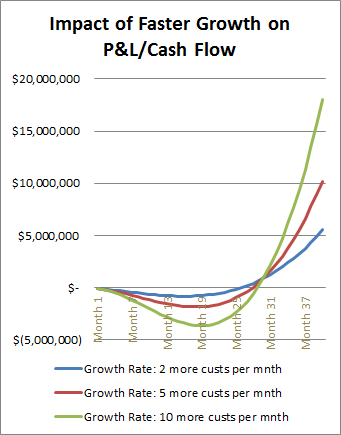
But there is light at the end of the tunnel, as eventually there is enough profit/cash from the installed base to cover the investment needed for new customers.
但隧道尽头是有光的——存量客户产生的利润/现金最终会足以覆盖新增客户所需的投入。
At that point the business would turn profitable/cash flow positive – assuming you don't decide to increase spending on sales and marketing.
到那一刻,生意会转为盈利和正现金流——前提是你不决定继续加码销售和市场预算。
And, as expected, the faster the growth in customer acquisition, the better the curve looks when it becomes positive.
而且正如你预想的那样:获客增长越快,曲线翻正之后的形态就越好看。
If plans go well, you may decide it is time to hit the accelerator (increasing spending on lead generation, hiring additional sales reps, adding data center capacity, etc.) in order to pick-up the pace of customer acquisition.
如果一切按计划推进,你可能会决定踩下油门——加大获客投入、招更多销售、扩数据中心容量,等等——来提速。
The thing that surprises many investors and boards of directors about the SaaS model is that, even with perfect execution, an acceleration of growth will often be accompanied by a squeeze on profitability and cash flow.
让很多投资人和董事会成员吃惊的是:即便执行完美,SaaS 模型下的"加速"也几乎一定伴随着利润和现金流被挤压。
As soon as the product starts to see some significant uptake, investors expect that the losses / cash drain should narrow, right?
产品一开始放量时,投资人会期待亏损和现金消耗收窄,对吧?
Instead, this is the perfect time to increase investment in the business, which will cause losses to deepen again.
恰恰相反,这正是加码投资的最好时机——而加码会让亏损再度加深。
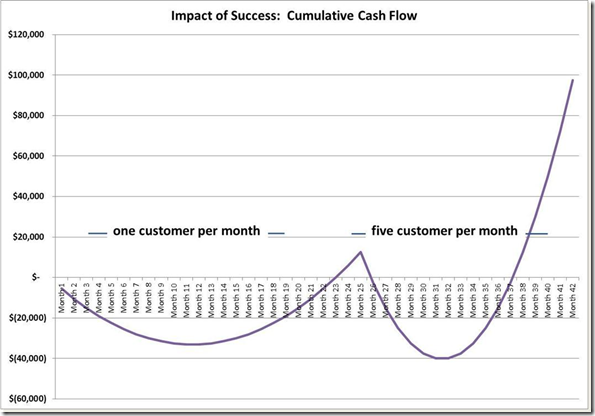
Notice in the example graph that the five customer per month model ultimately yields a much steeper rate of growth, but you have to go through another deep trough to get there.
注意图里:每月 5 个客户的模型最终增长曲线要陡得多,但你必须再穿过一次很深的低谷才能走到那一步。
It is the concept of needing to re-enter that type of trough after just having gotten the curve to turn positive that many managers and investors struggle with.
"曲线刚翻正,又要主动跳回低谷"——这个概念,是很多管理者和投资人难以接受的。
Of course this a special challenge early-on as you need to explain to investors why you'll require additional cash to fund that next round of acceleration.
早期这件事尤其难——你得跟投资人解释,为什么你又需要一笔新钱来支持下一轮加速。
But it isn't just a startup problem.
但这不是创业公司独有的问题。
At NetSuite, even as a public company our revenue growth rate has accelerated in each of the last three years.
在 NetSuite,即便已经上市,我们过去三年收入增长率每年都在加速。
That means that each annual plan involves a stepping-up of investment in lead generation and sales capacity that will increase spending and cash flow out for some time before it starts yielding incremental revenue and cash flow in.
这意味着每年的预算都意味着:获客和销售产能上的加码先把支出和现金流流出推上去,要过一段时间才开始换来新的收入和现金流入。
As long as you're accelerating the rate of revenue growth, managing and messaging around this phenomenon is a permanent part of the landscape for any SaaS company.
只要你还在加速收入增长,管理这个现象、并把它对内对外讲清楚,就是 SaaS 公司永远要做的功课。
Why is growth important?
We have suggested that as soon as the business has shown that it can succeed, it should invest aggressively to increase the growth rate.
前面我们一直在说:生意一旦显示出"能跑通"的迹象,就应当激进地加大投入、推高增长速度。
You might ask question: Why?
你可能会问:为什么?
SaaS is usually a "winner-takes-all" game, and it is therefore important to grab market share as fast as possible to make sure you are the winner in your space.
SaaS 多半是一场"赢家通吃"的游戏——所以尽可能快地抢市场份额、确保你是那个赢家,非常重要。
Provided you can tell a story that shows that eventually that growth will lead to profitability, Wall Street, acquiring companies, and venture investors all reward higher growth with higher valuations.
只要你能讲清楚"这个增长最终会通向盈利",华尔街、收购方和 VC 都会用更高的估值回报更高的增长速度。
There's also a premium for the market leader in a particular space.
而且,某个细分市场的领跑者,还会额外享受一份"龙头溢价"。
However not all investments make sense.
话虽如此,并不是所有投资都值得做。
In the next section we will look at a tool to help you ensure that your growth initiatives/investments will pay back: Unit Economics.
下一节我们看一个工具,它能帮你判断"这笔增长投入会不会回本"——它叫 Unit Economics。
A Powerful Tool: Unit Economics
Because of the losses in the early days, which get bigger the more successful the company is at acquiring customers, it is much harder for management and investors to figure out whether a SaaS business is financially viable.
由于早期会有亏损,而且公司在获客上越成功这个亏损就越大,管理层和投资人想搞清楚"这个 SaaS 生意财务上行不行"就格外困难。
We need some tools to help us figure this out.
我们需要一些工具来帮自己判断。
A great way to understand any business model is to answer the following simple question:
理解任何一个商业模式,最有效的办法之一就是回答下面这个简单问题:
Can I make more profit from my customers than it costs me to acquire them?
我从客户身上挣到的利润,能不能多过我把这个客户拉过来花的钱?
This is effectively a study of the unit economics of each customer.
这其实就是在研究单个客户的"单位经济学"(unit economics)。
To answer the question, we need two metrics:
要回答这个问题,我们需要两个指标:
LTV – the Lifetime Value of a typical customer
CAC – the Cost to Acquire a typical Customer
LTV(Lifetime Value)— 一个典型客户在生命周期内能贡献的总价值
CAC(Cost to Acquire a Customer)— 获取一个典型客户的成本
(For more on how to calculate LTV and CAC, click here.)
(LTV 与 CAC 的具体计算方法,见这篇定义篇。)
Entrepreneurs are usually overoptimistic about how much it costs to acquire a customer.
创业者对获客成本通常都过于乐观。
This probably comes from a belief that customers will be so excited about what they have built, that they will beat a path to their doors to buy the product.
这种乐观大概源于一种信念——他们觉得自己做的产品会让客户兴奋到踏破门来求购。
The reality is often very different! (I have written more on this topic here: Startup Killer: The Cost of Customer Acquisition, and here: How Sales Complexity impacts CAC.)
现实往往很不一样!(我在另外两篇文章里讨论得更深:Startup Killer: The Cost of Customer Acquisition,以及 How Sales Complexity impacts CAC。)
Is your SaaS business viable?
In the first version of this article, I introduced two guidelines that could be used to judge quickly whether your SaaS business is viable.
在这篇文章的 1.0 版里,我提过两条"快速判别 SaaS 生意是否可行"的经验法则。
The first is a good way to figure out if you will be profitable in the long run, and the second is about measuring the time to profitability (which also greatly impacts capital efficiency).
第一条用来判断你长期能否盈利,第二条用来衡量"多久能到盈利点"——这也极大地影响资本效率。
Over the last two years, I have had the chance to validate these guidelines with many SaaS businesses, and it turns out that these early guesses have held up well.
过去两年里,我有机会用许多 SaaS 公司的数据去验证这两条经验法则,事实证明它们站得住。
The best SaaS businesses have a LTV to CAC ratio that is higher than 3, sometimes as high as 7 or 8.
最好的 SaaS 公司 LTV/CAC 比值通常大于 3,有时能高到 7、8 倍。
And many of the best SaaS businesses are able to recover their CAC in 5-7 months.
而其中最好的那批公司能在 5-7 个月内收回 CAC。
However many healthy SaaS businesses don't meet the guidelines in the early days, but can see how they can improve the business over time to get there.
但很多健康的 SaaS 公司在早期并不满足这两条经验法则——它们的关键在于,能看清自己怎样随时间把指标改造到位。
The second guideline (Months to Recover CAC) is all about time to profitability and cash flow.
第二条经验法则——"多少个月收回 CAC"——本质上是在衡量"多久能到盈利点"和现金流。
Larger businesses, such as wireless carriers and credit card companies, can afford to have a longer time to recover CAC, as they have access to tons of cheap capital.
像移动运营商、信用卡公司这种大企业,可以接受更长的 CAC 回收期——因为它们能拿到海量的便宜资本。
Startups, on the other hand, typically find that capital is expensive in the early days.
而创业公司在早期通常会发现:资本是很贵的。
However even if capital is cheap, it turns out that Months to recover CAC is a very good predictor of how well a SaaS business will perform.
但即便资本便宜,"几个月收回 CAC"这个指标也是 SaaS 公司未来表现的一个非常好的预测变量。
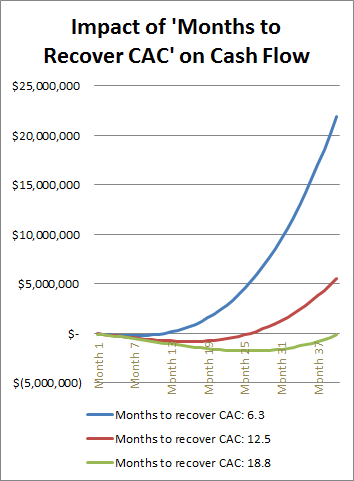
Take a look at the graph below, which comes from the same model used earlier.
看一下下面这张图,数据来自前面那个 Excel 模型。
It shows how the profitability is anemic if the time to recover CAC extends beyond 12 months.
它展示了一个事实:当 CAC 回收期超过 12 个月时,盈利能力非常孱弱。
I should stress that these are only guidelines, there are always situations where it makes sense to break them.
我得强调:这两条只是经验法则,总有些场景下打破它们是合理的。
Three uses for the SaaS Guidelines
One of the key jobs of the CEO is to decide when to hit the accelerator pedal.
CEO 最重要的工作之一,就是决定什么时候踩油门。
The value of these two guidelines is that they help you understand when you have a SaaS business that is in good shape, where it makes sense to hit the accelerator pedal.
这两条法则的价值,在于帮你判断:此时此刻 SaaS 生意状态是不是已经足够好、值得踩下油门了。
Alternatively if your business doesn't meet the guidelines, it is a good indicator that there is more tweaking needed to fix the business before you should expand.
反过来,如果生意还达不到这两条法则的水平,这就是一个明确信号:在你大举扩张之前,还要再调整、修补。
Another way to use the two guidelines is for evaluating different lead sources.
第二个用法是评估不同的渠道来源(lead source)。
Different lead sources (e.g. Google AdWords, TV, Radio, etc.) have different costs associated with them.
不同的渠道(比如 Google AdWords、电视、广播等)有不同的成本结构。
The guidelines help you understand if some of the more expensive lead generation options make financial sense.
用这两条法则,你可以判断那些更贵的渠道在财务上是否合算。
If they meet these guidelines, it makes sense to hit the accelerator on those sources (assuming you have the cash).
如果它们能满足这两条法则,就值得在这些渠道上踩油门——前提是你手里有钱。
Using the second guideline, and working backwards, we can tell that if we are getting paid $500 per month, we can afford to spend up to 12x that amount (i.e. $6,000) on acquiring the customer.
把第二条法则反推一下:如果客户每月付 $500,我们最多可以花 12 倍的钱(也就是 $6,000)去获取一个客户。
If we're spending less than that, you can afford to be more aggressive and spend more in marketing or sales.
如果当前的获客成本低于这个上限,你就还有空间在市场或销售上加码。
There is another important way to use this type of guideline: segmentation.
第三个用法很重要:客户分层(segmentation)。
Early-stage companies are often testing their offering with several different uses/types of customers / pricing models / industry verticals.
早期公司经常会在不同的用法、不同类型的客户、不同的定价模式、不同行业纵向之间做试探。
It is very useful to examine which segments show the quickest return or highest LTV to CAC in order to understand which will be the most profitable to pursue.
用 LTV/CAC 和回收期这两条法则去看哪些细分回报最快、ratio 最高,你就知道哪个方向最值得继续投入。
Unit Economics in Action: HubSpot Example
HubSpot's unit economics were published in an article in Forbes:
HubSpot 的单位经济学曾被 Forbes 一篇文章公开披露:
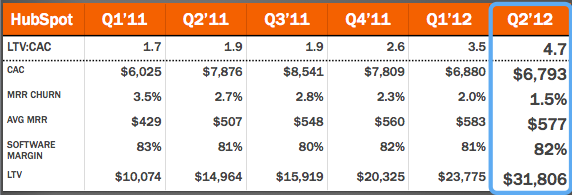
You can see from the second row in this table how they have dramatically improved their unit economics (LTV:CAC ratio) over the five quarters shown.
看表里的第二行可以发现,HubSpot 在这五个季度里把 LTV/CAC 比值大幅改善。
The big driver for this was lowering the MRR Churn rate from 3.5% to 1.5%.
最大的推动力是把 MRR 流失率从 3.5% 降到 1.5%。
This drove up the lifetime value of the customer considerably.
这显著拉高了客户的生命周期价值。
They were also able to drive up their AVG MRR per customer.
同时,他们也把平均每个客户的 MRR 提了上去。
In 2011 and early 2012 we used this chart to guide many of our business decisions at HubSpot.
2011 年和 2012 年初,我们在 HubSpot 用这张表指导了大量的业务决策。
By breaking LTV:CAC down into its components we could examine each metric and understand what levers we could pull to drive overall improvement.
把 LTV:CAC 拆成它的各个组成部分之后,我们就能逐个看每个指标、搞清楚自己能拉哪些杠杆来让整体变好。
It turned out that the levers we could pull varied by segment.
结果发现:能拉的杠杆,在不同客户分层里是不一样的。
In the SMB market for instance we had the right sales process in place – but had an opportunity to improve LTV by improving the product to lower churn and increasing our average price in the segment.
比如 SMB 市场,我们的销售流程已经对了——但还有改进 LTV 的空间,办法是把产品做得更好以降低流失、并提高这一段的平均单价。
In the VSB (Very Small Business) segment, by contrast, there wasn't as much upside left on the LTV (VSB customers have less money and naturally higher churn) so we focused on lowering CAC by removing friction from our sales process and moving more of our sales to the channel.
而极小企业(VSB)那一段,LTV 已经没什么余地可挖——VSB 客户钱少、天然流失高——所以我们的重心放在降 CAC 上:消除销售流程里的摩擦,把更多的销售动作搬到渠道伙伴去做。
Two Kinds of SaaS & Bookings: Three Contributing Elements
There are two kinds of SaaS business:
SaaS 公司可以分成两种:
Those with primarily monthly contracts, with some longer term contracts. In this business, the primary focus will be on MRR (Monthly Recurring Revenue).
第一种:以月度合同为主,辅以少量更长周期的合同。这种生意的核心指标是 MRR(Monthly Recurring Revenue,月度经常性收入)。
Those with primarily annual contracts, with some contracts for multiple years. Here the primary focus is on ARR (Annual Recurring Revenue), and ACV (Annual Contract Value).
第二种:以年度合同为主,辅以一些多年合同。这种生意的核心指标是 ARR(Annual Recurring Revenue,年度经常性收入)和 ACV(Annual Contract Value,年合同价值)。
Most of the time in this article, I will refer to ARR.
本文里大部分时候我会用 ARR 这个词。
This means use MRR if you are the first kind of business, or ARR if you are the second kind of business.
这只是说:你如果是第一种公司就把 ARR 替换成 MRR,如果是第二种就直接用 ARR。
The dashboard shown below assumes monthly contracts (ARR).
后面我会展示一张 Dashboard,默认假设是月度合同(用 ARR 来标注)。
However in the downloadable spreadsheet, there is a tab that shows the same dashboard for the second kind, focusing on MRR instead of ARR.
不过可下载的 Excel 表格里另外有一页,展示同一个 Dashboard 在第二种公司下的版本——用 MRR 替换 ARR。
SaaS Bookings: Three Contributing Elements
Every year in a SaaS business, there are three elements that contribute to how much ARR will change relative to the previous year:
在一家 SaaS 公司里,每年 ARR 相对去年的变化,都由三个分量构成:
What happened with new customers added in the year (or month):
• New ARR (or MRR)
这一年(或这一个月)新加的客户贡献了什么:
• New ARR(或 New MRR)
What happened in the installed base of customers:
• Churned ARR (or MRR) — from existing customers that cancelled their subscription. This will be a negative number.
• Expansion ARR (or MRR) — from existing customers who expanded their subscription.
存量客户那边发生了什么:
• Churned ARR(或 MRR)——来自取消订阅的存量客户。这是一个负数。
• Expansion ARR(或 MRR)——来自扩容/升级的存量客户。
The sum of all three of these makes up your Net ARR or MRR Bookings:
这三项之和,就构成你的 Net ARR(或 Net MRR)Bookings:
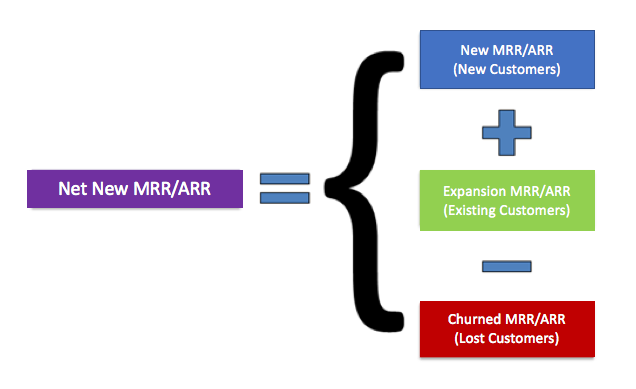
I recommend that you track these using a chart similar to the one below:
我建议你用类似下面这张图来追踪这些数据:
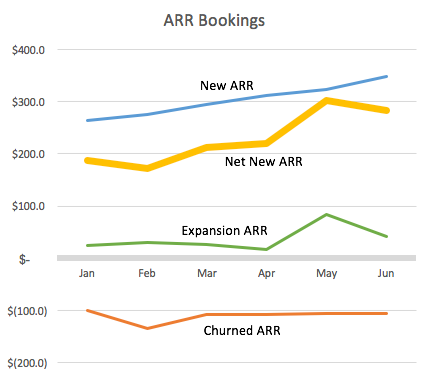
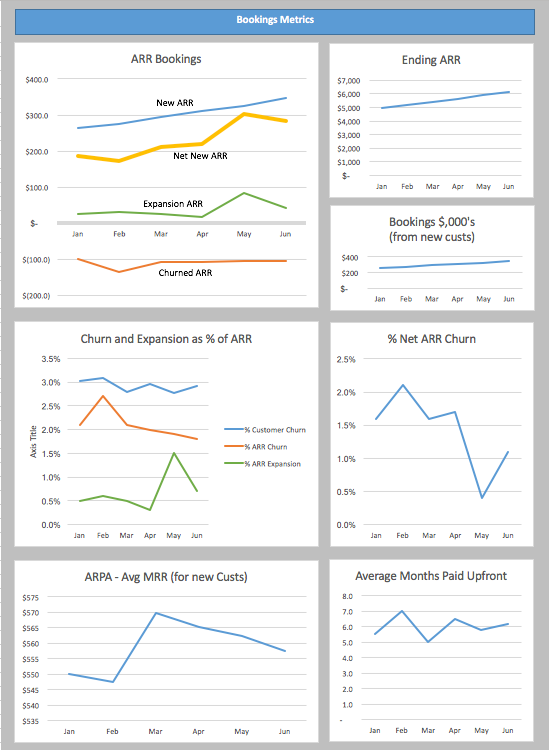
This chart shows the three components of ARR (or MRR) Bookings, and the Net New ARR (or MRR) Bookings.
这张图同时展示了 ARR(或 MRR)Bookings 的三个分量,和 Net New ARR(或 MRR)Bookings。
By breaking out each component, you can track the key elements that are driving your business.
把每个分量分开看,你才能看清楚到底是哪几个要素在推着生意往前走。
The one variation we would recommend making to this chart is to show a dotted line for the plan, so you can track how you are doing against plan for each of the four lines.
建议在这张图上额外加一条"计划值"的虚线——这样你就能在四条线上分别看自己跟计划比表现如何。
This is one of the most important charts to help you understand and run your business.
这是你管 SaaS 公司时最重要的一张图之一。
This chart is really good.
这张图真的非常好用。
I also like to look at this data in tabular form because I want to know y-o-y growth rates.
我还喜欢把这些数据看成表格形式,因为我想看同比增长率。
E.g. "Net new MRR is up 25% over June of last year". The Y-o-Y % is a metric easily compared with increased spending, sales capacity, etc.
比如说"Net new MRR 比去年六月增长了 25%"——这种同比百分比可以很方便地拿去跟支出加码、销售产能扩张等动作做对比。
Customer Retention & The Power of Negative Churn
In the early days of a SaaS business, churn really doesn't matter that much.
SaaS 公司在早期,流失其实没那么要紧。
Let's say that you lose 3% of your customers every month.
假设你每个月流失 3% 的客户。
When you only have a hundred customers, losing 3 of them is not that terrible.
你只有 100 个客户时,丢 3 个不算严重。
You can easily go and find another 3 to replace them.
再找 3 个补上来很容易。
However as your business grows in size, the problem becomes different.
但生意规模一旦做大,这个问题就变得完全不同了。
Imagine that you have become really big, and now have a million customers. 3% churn means that you are losing 30,000 customers every month!
想象一下你做得很大了,有了 100 万客户——3% 的流失就意味着每月丢 3 万个客户!
That turns out to be a much harder number to replace.
这是一个难得多的补缺数字。
Companies like Constant Contact have run into this problem, and it has made it very hard for them to keep up their growth rate.
像 Constant Contact 这样的公司就撞过这堵墙——它让他们很难维持原来的增长率。
One oft-overlooked aspect of churn is that the churn rate, combined with the rate of new ARR adds, not only defines how fast you can grow the business, it also defines the maximum size the business can reach (see graph below).
流失率有一个常被忽略的面向:它和新增 ARR 的速度一起,不只决定你这个生意增长得多快,还决定了这个生意最终能做多大(见下图)。
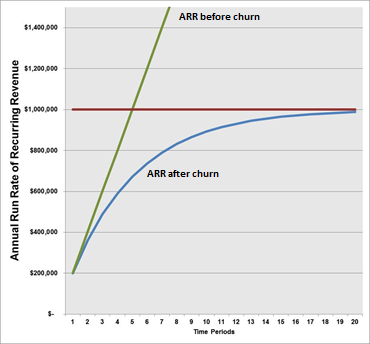
It is an enlightening exercise to build a simple model like this for your business and plot where your current revenue run rate sits on the blue line defined by your present rate of ARR adds and churn.
为你的生意搭一个这样的简单模型,然后把当前收入的 run rate 标到这条由"新增 ARR 速度 × 流失率"定义的蓝线上——这是个非常启发性的练习。
Are you near the left-hand side, where the growth is still steep and the ceiling is still far above?
你是在曲线左侧吗——那里增长还很陡、天花板还远?
Or, are you further to the right where revenue growth will level off and there is limited room left to grow?
还是已经偏右边了——收入增长开始走平、剩下的空间已经不多?
How much benefit will you get from small improvements in churn or the pace of new business sign-up?
那么"流失率小幅改善"或者"签单速度小幅提升",分别能给你带来多大的收益?
At NetSuite, we've had great success shifting the line in the last few years by both dramatically decreasing churn and by increasing average deal size and volume, thus increasing ARR adds.
在 NetSuite,过去几年我们成功地把这条线整体往上推——一边大幅降流失,一边把平均单笔金额和成交量都做上去,从而推高了新增 ARR。
The result was both to steadily move the limit upward and to steepen the growth curve at the current ARR run rate, creating room for increasingly rapid expansion.
结果是两件事同时发生:天花板逐步抬高,当前 ARR 水平上的增长曲线变陡——给"越跑越快地扩张"腾出了空间。
The Power of Negative Churn
The ultimate solution to the churn problem is to get to Negative Churn.
解决流失问题的终极方案,是做到 Negative Churn(净负流失)。
There are two ways to get this expansion revenue:
拿到这种"扩展收入"有两种办法:
1. Use a pricing scheme that has a variable axis, such as the number of seats used, the number of leads tracked, etc. That way, as your customers expand their usage of your product, they pay you more.
1. 定价里带一个可变维度——比如座位数、跟踪的 leads 数等等。这样客户用得越多、付得也越多。
2. Upsell/Cross-sell them to more powerful versions of your product, or additional modules.
2. 把他们升级(upsell)或交叉销售(cross-sell)到更强大的产品版本,或者额外的模块。
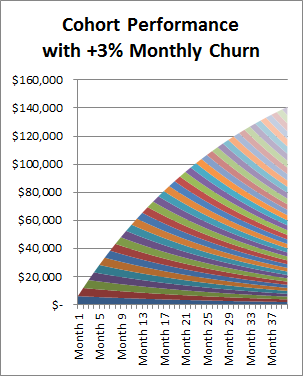
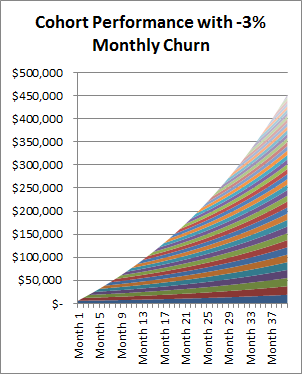
To help illustrate the power of negative churn, take a look at the following two graphs that show how cohorts behave with 3% churn, and then with 3% negative churn.
为了说明 Negative Churn 的威力,看看下面两张图——它们展示了不同 cohort 在 3% 流失率 vs 3% 净负流失下的演变。
(Since this is the first time I have used the word Cohort, let me explain what it means. A cohort is simply a fancy word for a group of customers. In the SaaS world, it is used typically to describe the group that joined in a particular month. So there would be the January cohort, February cohort, etc. In our graphs below, a different color is used for each month's cohort, so we can see how they decline or grow, based on the churn rate.)
(因为这是我第一次用 cohort 这个词,先解释一下:cohort 就是"一组客户"的花哨说法。在 SaaS 语境里,它通常用来指"在某一个月一起进来"的那组客户——所以会有"1 月 cohort"、"2 月 cohort"等等。下面两张图里每个月的 cohort 用不同颜色画,这样我们能看清楚它们随着流失率怎么衰减或增长。)
In the top graph, we are losing 3% of our revenue every month, and you can see that with a constant bookings rate of $6k per month, the revenue reaches $140k after 40 months, and growth is flattening out.
上面那张图里,我们每个月损失 3% 的收入。可以看到:每月恒定签下 $6k bookings 的情况下,40 个月后收入到达 $140k,增长在变平。
In the bottom graph, we may be losing some customers, but the remaining customers are more than making up for that with increased revenue.
下面那张图里,我们也丢了一些客户——但留存下来的客户带来的额外收入,完全把流失填回来了还有富余。
With a negative churn rate of 3%, we reach $450k in revenue (more than 3x greater), and the growth in revenues is increasing, not flattening.
在 3% 的净负流失下,收入达到 $450k(超过 3 倍),而且增长是在加速,不是变平。
For more on this topic, you may wish to refer to these two blog posts of mine:
想看更多这方面的讨论,可以参考我另外两篇博客:
Why Churn is SO critical to success in SaaS
Multi-axis Pricing: a key tool for increasing SaaS revenue
For information on how to calculate LTV when you have negative churn, I have written another article here: What's your TRUE customer lifetime value (LTV)? – DCF provides the answer.
如果你的生意已经做到 negative churn,该怎么算 LTV?我另外写过一篇:What's your TRUE customer lifetime value (LTV)? – DCF provides the answer。
Defining a Dashboard for a SaaS Company
The following section should be most useful for readers who are interested putting together a dashboard to help them manage their SaaS business.
下面这一节,对那些想搭一张管理 Dashboard 来跑 SaaS 公司的读者最有用。
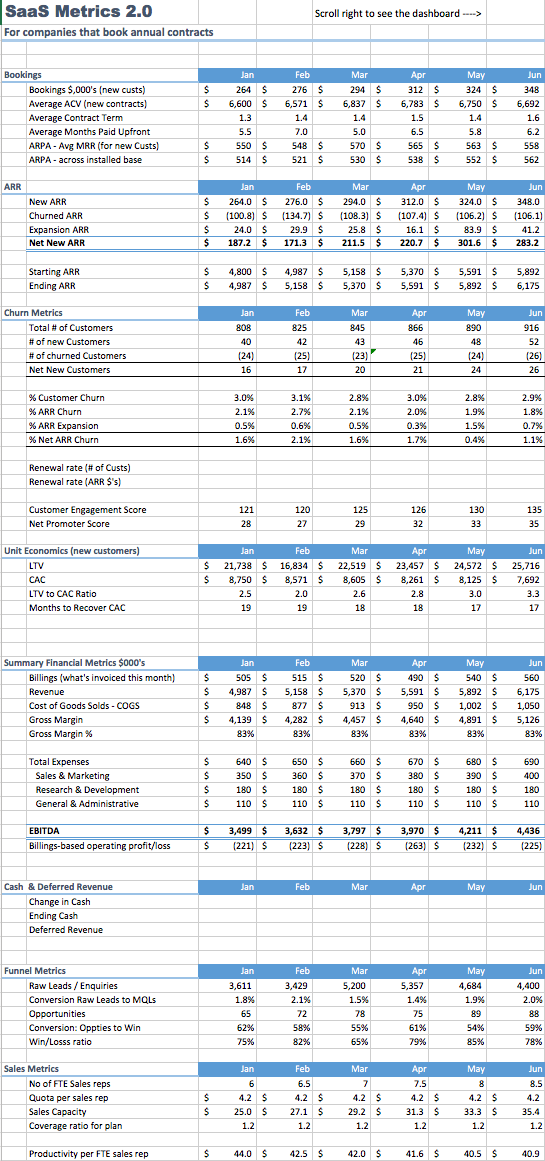
To this, we created an excel file for an imaginary SaaS company, and laid out a traditional numeric report on one tab, and then a dashboard of graphs on a second tab (see below).
为此我们给一家虚构的 SaaS 公司做了一个 Excel 文件:一页是传统的数字报表,另一页是图表化的 Dashboard(见下图)。
These represent one view on how to do this.
这只代表"一种"做法。
You may have a very different approach.
你可能会有完全不同的思路。
But hopefully this will give you some ideas.
但希望这能给你一些启发。
I would recommend adding a dotted line with the plan number to all graphs.
我会建议在所有图里都加一条"计划值"的虚线。
This will allow you to quickly see how you are doing versus plan.
这样你就能一眼看出实际 vs 计划的差距。
There are two versions of the Dashboard: the one shown below, which is designed for companies using primarily annual contracts (focused on ARR).
Dashboard 有两个版本:下面这张是给以年度合同为主的公司用的(以 ARR 为核心)。
You can find a version here (see Primarily Monthly Contracts tab) which is designed for companies using monthly contracts, focusing on MRR (Monthly Recurring Revenue).
另一个版本在这里(看 "Primarily Monthly Contracts" 那一页)——给以月度合同为主、以 MRR 为核心的公司用。
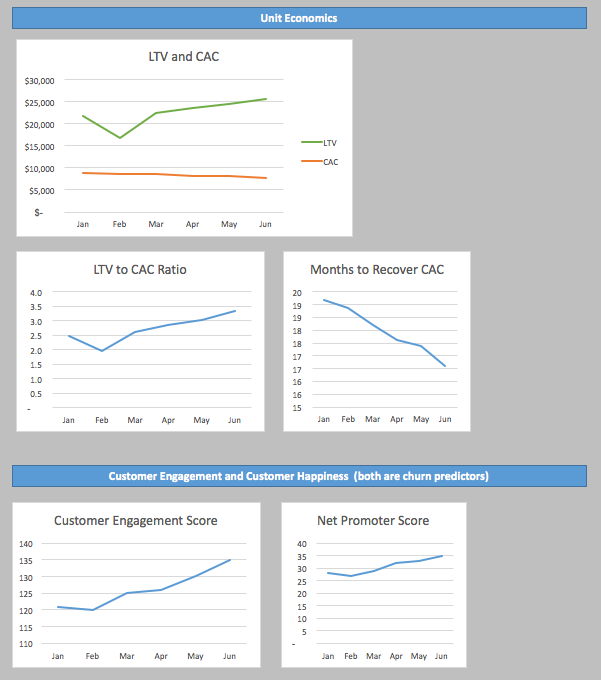
At HubSpot we obsess over these metrics – and watch many of them every day.
在 HubSpot,我们对这些指标痴迷——其中许多是每天都看的。
Each night we send out a 'waterfall' chart that tracks our progress against our typical progress given the number of business days left in the month.
每天晚上我们都会群发一张"瀑布图"(waterfall chart),用来跟踪当前进展 vs 按本月剩余工作日推算的"应该进展"。
Here is an example of what we look at to ensure we're on track to meet our net MRR goals.
下面是一个示例——这是我们用来确认能否完成 Net MRR 目标的图。
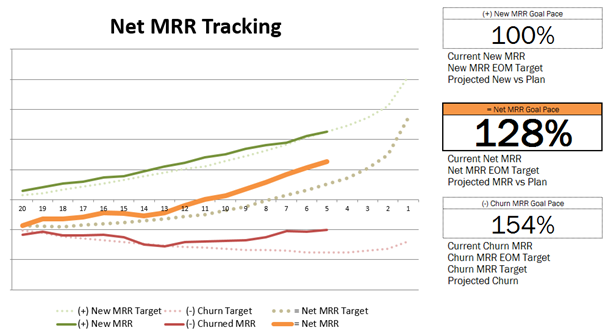
By looking at this daily we can take action immediately if we're tracking towards a bad month or quarter.
每天看这张图,如果当前走势指向"一个糟糕的月份或季度",我们能立刻动起来。
Things like services promotion (for churned MRR) or sales contests & promotions (for new & expansion MRR) are adjustments we make within a given month in order to nail our goals.
比如:对流失 MRR——做服务侧的挽留;对新增和扩展 MRR——做销售竞赛和促销。这些都是我们在月内可以临时调动的杠杆。
(In this model we combine expansion and churned MRR into one churned MRR line).
(在这个模型里,我们把 expansion 和 churned MRR 合并成一条 churned MRR 线。)
Detailed definitions of the various metrics used
Detailed definitions for each of the various metrics used can be found here: Click here for detailed definitions of SaaS Metrics.
每个指标的详细定义,见 SaaS Metrics Definitions 字典页。
Revenue Churn vs Customer Churn — why are they different?
You might be wondering why it's necessary to track both Customer Churn and Revenue Churn.
你可能会问:为什么要同时跟踪客户流失和收入流失这两个数?
Imagine a scenario where we have 50 small accounts paying us $100 a month, and 50 large accounts paying us $1,000 a month.
想象这样一个场景:我们有 50 个小客户,每月付 $100;另有 50 个大客户,每月付 $1,000。
In total we have 100 customers, and an MRR of $55,000 at the start of the month.
总共 100 个客户,月初 MRR 是 $55,000。
Now imagine that we lose 10 of them.
现在假设我们丢了其中 10 个客户。
Our Customer churn rate is 10%.
客户流失率就是 10%。
But if out of the ten churned customers, 9 of them were small accounts, and only one was a large account, we would only have lost $1,900 in MRR.
但如果这 10 个流失客户里有 9 个是小客户、只有 1 个是大客户,我们在 MRR 上只丢了 $1,900。
That represents only 3.4% Revenue Churn.
这只意味着 3.4% 的收入流失。
So you can see that the two numbers can be quite different.
可以看出,这两个数差异可能很大。
But each is important to understand if we want a complete picture of what is going on in the business.
但两个都得看——你才能拿到生意的完整画像。
Getting paid in advance
Getting paid in advance is really smart idea if you can do it without impacting bookings, as it can provide the cash flow that you need to cover the cash problem that we described earlier in the article.
如果不影响签单总额,让客户预付是个非常聪明的做法——它能提供你前文提到的现金流问题所需的资金。
It is often worth providing good financial incentives in the form of discounts to encourage this behavior.
通常值得用打折等好的财务激励手段来鼓励客户这么做。
The metric that we use to track how well your sales force is doing in this area is Months up Front.
衡量你的销售团队在这件事上做得怎样,用的指标叫 "Months up Front"(预付月数)。
Getting paid more upfront usually also helps lower churn.
让客户多预付,通常还能降低流失。
This happens because the customer has made a greater commitment to your service, and is more likely to spend the time getting it up and running.
原因是:客户已经做了更大的承诺,更有动力花时间把你的服务真正用起来。
You also have more time to overcome issues that might arise with the implementation in the early days.
你也有更多时间去处理早期实施过程中可能出现的问题。
The Metric "Months up Front" has been used at both HubSpot and NetSuite in the past as a way to incent sales people to get more paid up front when a new customer is signed.
"Months up Front" 这个指标 HubSpot 和 NetSuite 都用过,用来激励销售在新客户成交时争取更多的预付款。
However asking for more money up front may turn off certain customers, and result in fewer new customers, so be careful how you balance these two conflicting goals.
但要求更多预付款可能会吓退某些客户,导致新增客户减少——这两个相互冲突的目标怎么平衡,要小心。
Calculating CAC and LTV
*Update 05/2016 — I've written a new article: What's your TRUE Lifetime Value (LTV)? – DCF Provides the Answer that replaces all the formula that are shown in the link below.
*2016 年 5 月更新:我写了一篇新文章——What's your TRUE Lifetime Value (LTV)? – DCF Provides the Answer——它取代了下面那个链接里的所有公式。
Cohort Analysis, Engagement Score & NPS
Since churn is such a critical element for success in a SaaS company, it is an area that requires deeper exploration to understand.
流失对 SaaS 公司成功如此关键,所以这是一个值得深入挖掘的领域。
Cohort Analysis is one of the important techniques that we use to gain insight.
Cohort Analysis(分组分析)是我们用来获得这种洞察的重要手法之一。
As mentioned earlier, a cohort is simply a fancy name for a group.
前面提过,cohort 就是"一组"的花哨说法。
In SaaS businesses, we use cohort analysis to observe what happens to the group of customers that joined in a particular month.
在 SaaS 里,我们用 cohort 分析观察"在某一个月一起加入的这组客户"随时间的变化。
So we will have a January cohort, a February cohort, etc.
于是会有 1 月 cohort、2 月 cohort,以此类推。
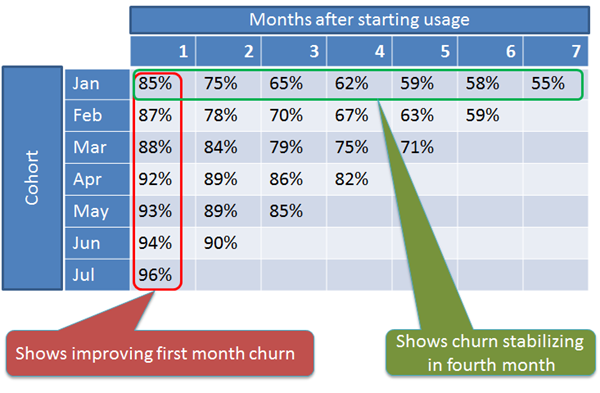
We would then be able to observe how our January cohort behaves over time (see illustration below).
这样我们就能观察 1 月 cohort 随时间的演变(见下图)。
This can help answer questions such as:
这能帮你回答这样几个问题:
1. Are we losing most of the customers in the first couple of months?
2. Does Churn stabilize after some period of time?
1. 大多数客户是不是在头几个月就流失了?
2. 流失率会不会在某个时间点稳定下来?
Then if took some actions to try to fix churn in early months, (i.e with better product features, easier on-boarding, better training, etc.) we would want to know if those changes had been successful.
如果你做了一些事情来改善早期流失(比如更好的产品特性、更顺畅的 onboarding、更好的培训等等),你会想知道这些动作是不是真的起效。
The cohort analysis allows us to do this by comparing how more recent cohorts (e.g. July in the table above) compared against January.
Cohort 分析让你能拿后来的 cohort(比如上面表里的 7 月)跟 1 月做对比。
The table above shows that we made a big improvement in the first month churn going from 15% to 4%.
上面那张表显示:我们把"入组第一个月的流失率"从 15% 降到了 4%——这是一个大幅改善。
Two ways to run Cohort Analysis
There are two ways to run Cohort Analysis: the first looks at the number of customers, and the second looks at the Revenue.
Cohort 分析有两种跑法:第一种看客户数,第二种看收入。
Each teaches us something different and valuable.
两者各有不同的、各自有价值的洞察。
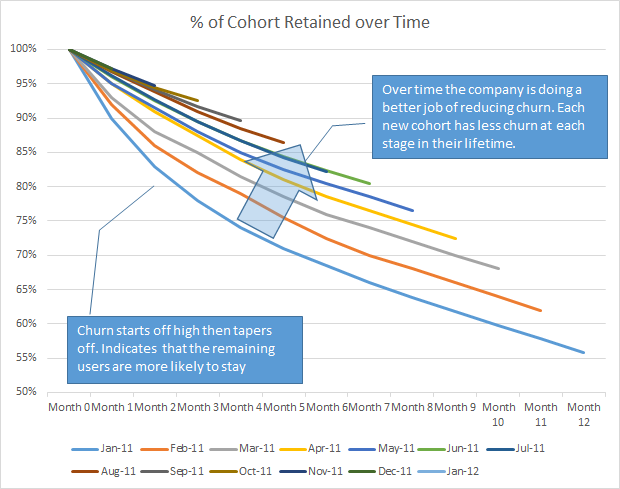
The example graph below simply looks at the number of customers in each cohort over time:
下面这张示例图是单纯看"每个 cohort 还剩多少客户":
The example graph below looks at how MRR evolves over time for each cohort.
下面这张图看的是每个 cohort 的 MRR 怎么随时间变化。
This particular example illustrates how the graph would look if there is very strong negative churn.
这张图刻画的是一个净负流失非常强的场景。
As you can see, the increase in revenue from the customers that are still using the service is easily outpacing the lost revenue from churned customers.
可以看到:仍在用服务的客户带来的收入增长,轻松超过了流失客户带走的那部分收入。
It is pretty rare to see things look this good, but it is the ideal situation that we are looking for.
这种图景在现实中相当罕见,但这就是我们追求的理想形态。
For those wondering if this can be achieved, one company in our portfolio, Zendesk, that has numbers that are even better than those shown in the example below.
如果你怀疑这种状态能不能做到——我们投资组合里的一家公司 Zendesk,数据比下面这张示例还要好。
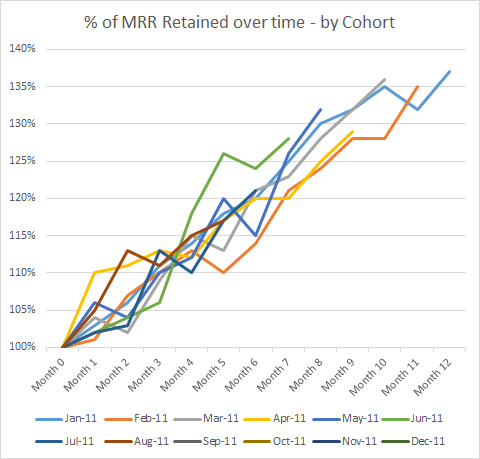
In the situation above, you will need a more complex formula to calculate LTV, as the value of the average customer is increasing over time.
上面这种场景下,你需要用一个更复杂的公式来算 LTV——因为平均客户价值在随时间增长。
For more on that topic, you may want to check out the accompanying definitions document.
关于这个话题,可以参考配套的定义文档。
Predicting Churn: Customer Engagement Score
Since churn is so important, wouldn't it be useful if we could predict in advance which customers were most likely to churn?
既然流失这么重要,要是能提前预测哪些客户最可能流失,岂不是很有用?
That way we could put our best customer service reps to work in an effort to save the situation.
这样我们就能派出最好的客户成功代表去挽留他们。
It turns out that we can do that by instrumenting our SaaS applications and tracking whether our users are engaged with the key sticky features of the product.
事实证明这是可以做到的——办法是在你的 SaaS 应用里埋点,跟踪用户有没有在用产品最"粘"的那些关键功能。
Different features will deserve different scores.
不同的功能应该有不同的分值。
For example if you were Facebook, you might score someone who uploaded a picture as far more engaged (and therefore less likely to churn), than someone who simply logged in and viewed one page.
举例来说,如果你是 Facebook,你会给"上传了一张图"的人打很高的分(意味着他更活跃、更不可能流失),而给"只登录看了一页"的人打很低的分。
Similarly if you sold your SaaS product to a 100 person department, and only 10 people were using it, you would score that differently to 90 people using it.
同样地,如果你把 SaaS 卖给了一个 100 人的部门,但只有 10 个人在用,你给它打的分,应该跟"90 人在用"那种情况完全不同。
So the recommendation is that you create a Customer Engagement Score, based on allocating points for the particular features used.
所以建议是:做一个 Customer Engagement Score(用户活跃度评分),按"用了哪些功能"给客户打分。
Allocate more points for the features you believe are most sticky.
给那些你认为最"粘"的功能更多分。
(Later on you can go back and look at the customers who actually churned, and validate that you picked the right features as a predictor of who would churn.)
(过段时间你可以回头看看那些真的流失的客户,验证你当初选的功能是不是真的能预测流失。)
And separately score how many users are engaged with specific scores.
同时也要单独跟踪"有多少用户达到了某个分值"。
Over time you'll also come to discover which types of use are the best indicators of possible upsell.
随着时间推移,你也会发现哪些使用模式最能预测"这个客户接下来会买更多"。
(HubSpot was the first company that I worked with who figured this out, and they called it their CHI score.
(HubSpot 是我合作过的第一家把这件事做出来的公司,他们叫这个分数 CHI。
CHI stands for Customer Happiness Index.
CHI = Customer Happiness Index(客户满意度指数)。
It evolved to be a very good predictor for churn.)
这个分数后来演变成了一个非常好的流失预测变量。)
At HubSpot we had a lot of success looking at this metric – we called in Customer Happiness Index (CHI).
在 HubSpot,我们在这个指标上获得了很大的成功——我们叫它 Customer Happiness Index(CHI)。
First – by running the analysis we identified the parts of our application that provide the most value to customers and could invest accordingly in driving adoption in those areas.
第一件事:跑这个分析让我们识别出产品里"给客户带来最大价值的部分",于是我们就能据此投入资源,推动用户在这些点上的采用。
Second – we used this aggregate score as an early proxy for success as we experimented with different sales and onboarding processes.
第二件事:我们在实验不同的销售和 onboarding 流程时,把这个总分作为"成功的早期代理指标"。
If a set of customers going through an experiment had a low CHI score we could kill the project without waiting 6 or 12 months to analyze the cohort retention.
如果某个实验中这组客户的 CHI 分数很低,我们就可以直接干掉这个项目——不需要等 6 个月或 12 个月之后再去分析 cohort 留存。
NPS — Net Promoter Score
Since it is likely that customer satisfaction is likely to be good predictor of future churn, it would be useful to survey customer satisfaction.
既然客户满意度多半是未来流失的好预测指标,那对客户满意度做调查就很有价值。
The recommended way to measure customer happiness is to use Net Promoter Score (NPS).
衡量客户满意度的推荐方法是用 Net Promoter Score(NPS,净推荐值)。
The beauty of NPS is that it is a standardized number, so you can compare your company to others.
NPS 的好处在于它是一个标准化的数字,所以你可以拿来跟同行做横向对比。
For more comprehensive introduction to Net Promoter Score, click here.
想看 NPS 更全面的介绍,见这里。
Guidelines for Churn
If your Net Revenue Churn is high (above 2% per month) it is an indicator that there is something wrong in your business.
如果你的净收入流失高于每月 2%,这意味着你的生意里有地方出了问题。
At 2% monthly churn, you are losing about 22% of your revenue every year.
每月 2% 流失意味着你一年丢掉约 22% 的收入。
That is nearly a quarter of your revenue!
接近四分之一!
It's a clear indication that there is something wrong with the business.
这是一个很明确的信号:生意有问题。
As the business gets bigger, this will become a major drag on growth.
而且生意越大,这个问题就越会成为增长的主要拖累。
We recommend that you work on fixing the problems that are causing this before you go on to worry about other parts of your business.
我们建议你先把导致高流失的问题修好,再去操心生意里其它部分。
Some of the possible causes of churn are:
高流失的可能原因包括:
1. You are not meeting your customers expectations. The product may not provide enough value, or have instability / bugginess.
1. 你没满足客户的预期。产品给的价值不够,或者产品不稳定 / bug 多。
2. Your product is not sticky. It might provide some value in the first few months, and then once the customer has that value, they may feel they don't need to keep paying. To make your product sticky, try making it a key part of their monthly workflow, and/or have them store data in your product that is highly valuable to them, where the value would be lost of they cancelled.
2. 你的产品不"粘"。可能头几个月提供了一些价值,但价值兑现完之后,客户就觉得没必要再付钱了。要让产品粘住,要么把它做成客户每月工作流的关键一环,要么让客户在你产品里存有他们非常看重的数据——一旦取消订阅这些数据就丢了。
3. You have not successfully got the customer's users to adopt the product. Or they may not be using certain of the key sticky features in the product.
3. 你没让客户内部的用户真正用起来——或者他们没在使用产品里那些最"粘"的关键功能。
4. Your sales force may have oversold the product, or sold it to a customer that is not well suited to get the benefits.
4. 你的销售可能把产品过度承诺了,或者把它卖给了一个本就不适合从中受益的客户。
5. You may be selling to SMB's where a lot of them go out of business. It isn't enough that what you're selling is sticky. Who you're selling it to must also be sticky.
5. 你可能卖给了 SMB 客户,而其中很多客户自己就倒闭了。"卖什么"粘还不够——"卖给谁"也必须是稳定的。
6. You are not using a pricing scheme that helps drive expansion bookings.
6. 你的定价方案没有设计成能驱动扩展(expansion)签单。
The best way to find out why customers are churning is to get on the phone with them and ask them.
最有效的找根因办法,就是给流失客户打电话,直接问他们为什么走。
If churn is a significant part of your business, we recommend that the founders themselves make these calls.
如果流失在你的生意里是个大问题,我们建议这些电话由 founder 亲自打。
They need to hear first hand what the problem is, as this is so important for the success of the business.
Founder 需要第一手听见问题是什么——因为这件事对生意的成败太关键。
And they are likely to be the best people to design a fix for the problem.
而且 founder 往往也是最有能力设计修复方案的那个人。
The Importance of Customer Segmentation
In all SaaS businesses there will likely come a moment where they realize that not all customers are created equal.
所有 SaaS 公司,大概都会迎来这样一个时刻——意识到:不是所有客户都生而平等。
As an example, bigger customers are harder to sell to, but usually place bigger orders, and churn less frequently.
举个例子:大客户更难卖,但通常订单更大、流失也更少。
We need a way to understand which of these are most profitable, and this requires us to segment the customer base into different types, and compute the unit economics metrics for each segment separately.
我们需要一种办法来判断哪一段客户最赚钱——这就要求我们把客户按类型分层,然后分别计算每一段的 unit economics。
Common segments are things size of of customer, vertical industry, etc.
常见的分层维度有:客户规模、所属行业纵向等等。
Despite the added work to produce the metrics, there is high value in understanding the different segments.
虽然要为每个分层单独算指标会增加工作量,但理解各个分层的状况价值非常高。
This tells us which parts of the business are working well, and which are not.
它告诉你哪些部分跑得好、哪些没跑通。
In addition to knowing where to focus and invest resources, we may recognize the need for different marketing messages, product features.
除了告诉你资源往哪儿投以外,还可能让你意识到需要不同的市场话术和产品特性。
As soon as you start doing this segmented analysis, the benefits will become immediately apparent.
一旦你开始做分层分析,好处立刻就会显现。
For each segment, we recommend tracking the following metrics:
每个分层我们建议跟踪这些指标:
· ARPA (Average Revenue per Account per month)
· Net MRR Churn rate (including MRR expansion)
· LTV
· CAC
· LTV:CAC ratio
· Months to recover CAC
· Customer Engagement Score
· ARPA(每账号每月平均收入)
· Net MRR 流失率(包含扩展)
· LTV
· CAC
· LTV:CAC 比值
· CAC 回收期(月)
· Customer Engagement Score
At HubSpot, we started to see some of our biggest improvements in unit economics when we started segmenting our business and calculating the LTV to CAC ratio for each of our personas and go to market strategies.
在 HubSpot,当我们开始按客户画像和 GTM 策略分别计算 LTV:CAC 时,我们的 unit economics 出现了一些最大的飞跃。
As one good example – when we started this analysis, we had 12 reps selling directly into the VSB market and 4 reps selling through Value Added Resellers (VARs).
举个典型例子——刚开始做这个分析时,我们有 12 个销售直接卖给 VSB(极小企业)市场,4 个销售通过 VAR(增值经销商)渠道卖。
When we looked at the math we realized we had a LTV:CAC ratio of 1.5 selling direct, and a LTV:CAC ratio of 5 selling through the channel.
把账算清楚后我们发现:直销的 LTV:CAC 是 1.5,渠道的 LTV:CAC 是 5。
The solution was obvious.
答案很明显。
Twelve months later we had flipped our approach – keeping just 2 reps selling direct and 25 reps selling through the channel.
12 个月后,我们把策略完全反过来了——直销只留 2 个销售,渠道扩到 25 个。
This dramatically improved our overall economics in the segment and allowed us to continue growing.
这显著改善了这一段的整体经济学,也让我们能够继续增长。
We ended making similar investments in other high LTV:CAC segments.
我们在其他高 LTV:CAC 的分层里也做了类似的投入。
We went so far as to incentivize our sales managers to grow their teams – but then would only place new sales hires into the segments with the best economics.
我们甚至给销售经理设立了"团队壮大"的激励——但新招的销售只放在经济学最好的那些分层。
This ensured we continued to invest in the best segments and aligned incentives throughout the company on our LTV:CAC goals.
这样既保证了我们持续投资最好的分层,也让整家公司的激励都跟 LTV:CAC 目标对齐。
It also allowed us to push innovation down to the sales manager level.
这还让我们能把创新下放到销售经理这一层。
Managers could experiment with org structure, and sales processes – but they knew that if they didn't hit their LTV:CAC goals they wouldn't be able to grow their teams.
经理们可以试不同的组织结构、销售流程——但他们清楚:如果 LTV:CAC 没达标,团队就不能扩。
Calculating LTV:CAC by segment can be challenging, especially on the CAC side.
按分层算 LTV:CAC 是有难度的,尤其是 CAC 那一边。
It's relatively easy at the top level to add up all the marketing and sales expense in a period and divide it by the total number of customers (to get CAC).
在公司层面算 CAC 相对简单——把这一段时间里所有市场和销售开支加起来,除以总客户数就行。
Once you try to segment down your spend you run into questions like 'how much marketing expense do I allocate to a given segment', 'how much of the sales expense'?
但一旦你想把开支拆到各个分层,问题就来了:"我该把多少市场费用分给这一段?"、"销售费用怎么分?"
We solved this by allocating marketing expense based on number of leads and sales expense based on headcount but it's not perfect.
我们的解法是:市场费用按 leads 数分摊,销售费用按 headcount 分摊——这不完美。
For us the keys are: 1) Needs to account for all costs – no free lunch, 2) It needs to be consistent over time. Progress on improving the metric is more important than the actual value.
对我们来说,关键是:(1) 必须把所有成本都算进去——没有免费午餐;(2) 长时间内分摊方法要保持一致——指标改善的幅度比绝对值更重要。
Funnel Metrics, Sales Capacity & Lead Source ROI
The metrics that matter for each sales funnel, vary from one company to the next depending on the steps involved in the funnel.
每个销售漏斗里值得跟踪的指标,因公司不同而不同——取决于这个漏斗里有哪些环节。
However there is a common way to measure each step, and the overall funnel, regardless of your sales process.
但不管你的销售流程长什么样,衡量每一步和整个漏斗都有一套通用做法。
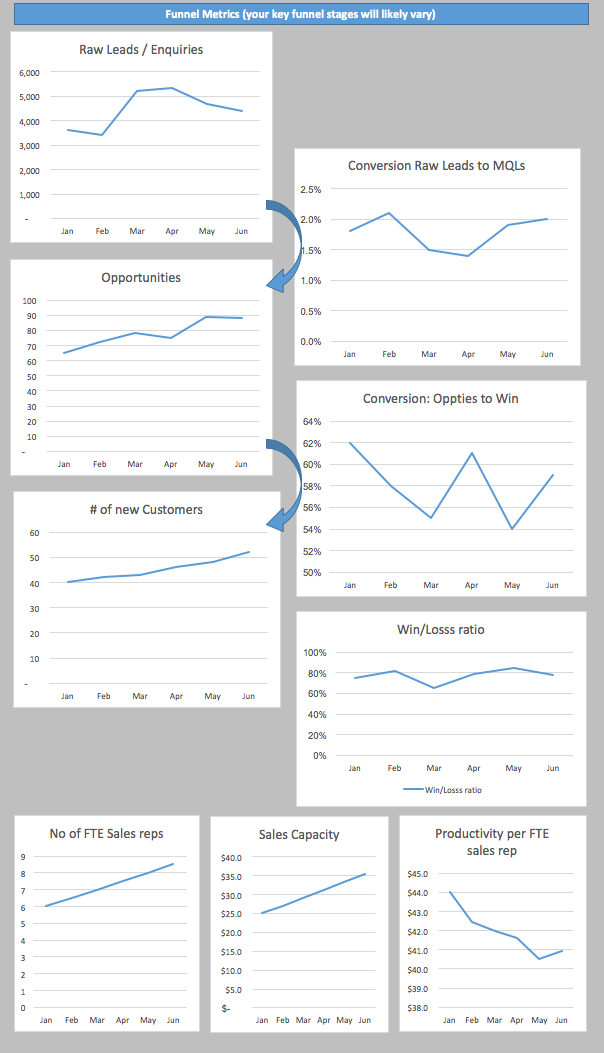
That involves measuring two things for each step: the number of leads that went into the top of that step, and the conversion rate to the next step in the funnel (see below).
那就是为每一步度量两件事:进入这一步的 leads 数,以及转化到下一步的转化率(见下图)。
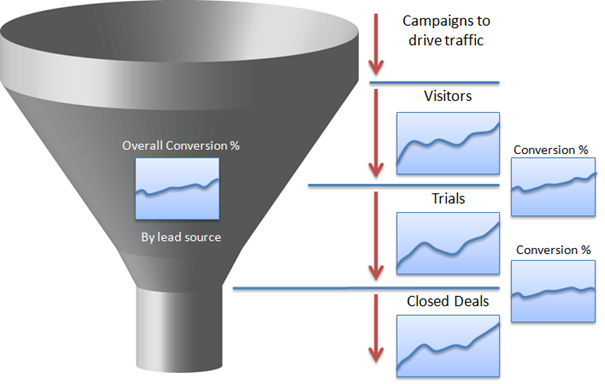
In the diagram above, (mirrored in the dashboard), we show a very simple three phase sales process, with visitors coming to a web site, and some portion of them signing up for a trial.
上图(和 Dashboard 里那张一致)展示了一个非常简单的三阶段销售流程:访客来到网站,其中一部分注册试用。
Then some of the trials convert to purchases.
然后试用用户里一部分会转化为付费购买。
As you can see in the dashboard, we will want to track the number of visitors, trials and closed deals.
如你在 Dashboard 里看到的,我们想跟踪三个绝对数:访客数、试用数、成交数。
Our goal should be to increase those numbers over time.
目标是让这些数随时间往上走。
And we will also want to track the conversion rates, with the goal of improving those over time.
同时也要跟踪各步的转化率——目标同样是随时间改善。
Using Funnel Metrics in Forward Planning
Another key value of having these conversion rates is the ability to understand the implications of future forecasts.
有了这些转化率,还有一个关键用途:你能搞清楚未来预测意味着什么。
For example, lets say your company wants to do $4m in the next quarter.
举例来说,假设你的公司想下一个季度做到 $4m。
You can work backwards to figure out how many demos/trials that means, and given the sales productivity numbers – how many salespeople are required, and going back a stage earlier, how many leads are going to be required.
你可以倒推:这意味着多少 demo/试用?给定单位销售产能,需要多少销售?再往前一步,需要多少 leads?
These are crucial planning numbers that can change staffing levels, marketing program spend levels, etc.
这些都是关键的计划数字,会改变招人节奏、市场投入预算等等。
Sales Capacity
In many SaaS businesses, sales reps play a key role in closing deals.
在很多 SaaS 公司里,销售在成交环节中扮演关键角色。
In those situations, the number of productive sales people (Sales Capacity) will be a key driver of bookings.
在这种公司里,"有产能的销售数量"(Sales Capacity)是 bookings 的关键驱动因子。
It is important to work backwards from any forecasts that are made, to ensure that there is enough sales capacity.
从任何一个销售预测往回倒推,确认产能够用,这件事很重要。
I've seen many businesses miss their targets because they failed to hire enough productive salespeople early enough.
我见过太多公司因为没能足够早地招到足够的"有产能"销售,导致没完成目标。
It's also worth noting that some percentage of new sales hires won't meet expectations, so that should be taken into consideration when setting hiring goals.
还要注意:一部分新招的销售达不到预期——所以做招人计划时这部分要预留。
Typically we have seen failure rates around 25-30% for field sales reps, but this varies by company.
外勤销售的失败率,我们看到的典型水平是 25-30%——因公司而异。
The failure rate is lower for inside sales reps.
Inside sales(电销)的失败率会低一些。
When computing Sales Capacity, if a newer rep is still ramping and only expected to deliver 50% of quota, they can be counted as half of a productive rep.
算 Sales Capacity 时,如果一个新销售还在 ramp 中,只预计完成 50% 的 quota,就算半个有效销售。
That is often referred to as Full Time Equivalent or FTE for short.
这通常称为 Full Time Equivalent(全职等效)或简称 FTE。
Another important metric to understand is the number of leads required to feed a sales rep.
另一个值得弄明白的指标是:养一个销售需要多少 leads。
If you are adding sales reps, make sure you also have a clear plan of how you will drive the additional leads required.
如果你在扩销售,务必同时有明确的计划,知道怎么把额外需要的 leads 拉出来。
There is much more that could be said on this topic, but since it is all very similar to managing a sales force in a traditional software company, we will leave that for other blog posts.
这个话题还能讲很多,但因为这跟管理一家传统软件公司的销售团队太像了,我们把它留给其他博客文章吧。
Understanding the ROI for different Lead Sources
Our experiences with SaaS startups indicate that they usually start with a couple of lead generation programs such as Pay Per Click Google Ad-words, radio ads, etc.
我们看 SaaS 创业公司的经验是:他们通常从两三个获客渠道起步——比如 Google AdWords 的 PPC、广播广告等等。
What we have found is that each of these lead sources tends to saturate over time, and produce less leads for more dollars invested.
而我们的发现是:这些渠道每个都会随时间饱和——花更多钱,产出更少 leads。
As a result, SaaS companies will need to be constantly evaluating new lead sources that they can layer in on top of the old to keep growing.
所以 SaaS 公司必须不断评估新渠道,把它们叠加到老渠道上,才能保持增长。
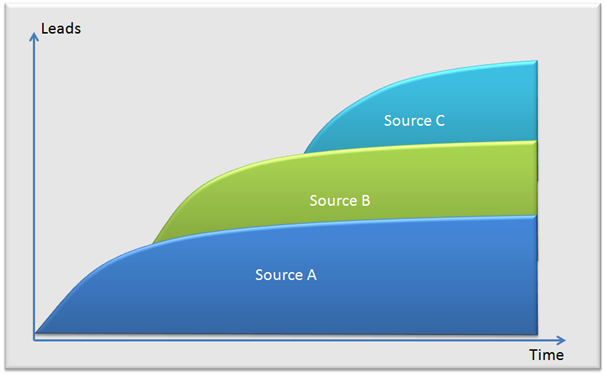
Since the conversion rates and costs per lead vary quite considerably, it is important to also measure the overall ROI by lead source.
由于不同渠道的转化率和 lead 单价差异很大,按渠道分别测整体 ROI 就显得很重要。
Growing leads fast enough to feed the front end of the funnel is one of the perennial challenges for any SaaS company, and is likely to be one of the greatest limiting factors to growth.
怎么把漏斗顶端的 leads 增长得足够快——这是每家 SaaS 公司永恒的挑战,也很可能是它们增长最大的天花板。
If you are facing that situation, the most powerful advice we can give you is to start investing in Inbound Marketing techniques (see Get Found using Inbound Marketing).
如果你正在面对这个困局,我们能给的最强建议是:开始投入 Inbound Marketing 这套打法(见 Get Found using Inbound Marketing)。
This will take time to ramp up, but if you can do it well, will lead to far lower lead costs, and greater scaling than other paid techniques.
它需要时间才能跑起来,但你做得好的话,lead 成本会比其他付费打法低得多,而且更能放量。
Additionally the typical SaaS buyer is clearly web-savvy, and therefore very likely to embrace inbound marketing content and touchless selling techniques.
而且典型的 SaaS 买家显然都很懂互联网——非常容易被 inbound 内容和"零接触式销售"打动。
Levers for Growth & The High Level Picture
SaaS businesses are more numerically driven than most other kinds of business.
SaaS 公司比大部分其他类型的公司,都更依赖数字驱动。
Making a small tweak to a number like the churn rate can have a very big impact on the overall health of the business.
像流失率这样的一个数字小幅调一点,就能对整体生意的健康度产生巨大影响。
Because of this we frequently see a "quant" (i.e. a numbers oriented, spreadsheet modeling, type of person) as a valuable hire in a SaaS business.
正因如此,我们常常看到 SaaS 公司里会有一个"quant"——也就是那种数字导向、做表格建模的人——作为非常关键的一员。
At HubSpot, Brad Coffey played that role, and he was able to run the models to determine which growth plays made the most sense.
在 HubSpot,这个角色是 Brad Coffey——他能跑模型来判断哪些增长动作最划算。
Understanding these SaaS metrics is a key step towards seeing how you can drive your business going forward.
理解这些 SaaS 指标,是你想清楚"接下来怎么推动这门生意"的关键一步。
Let's look at some of the levers that these imply as growth drivers for your business:
下面看看这些指标暗示了哪些可以拉的增长杠杆:
Churn
Get Churn and customer happiness right first (if this isn't right, the business isn't viable, so no point in driving growth elsewhere. You will simply be filling a leaky bucket.)
先把流失和客户满意度做对——这两件事不对,生意就不成立,在别的地方推增长毫无意义,你只是在给漏底的桶加水。
Product
You're in a product business – first and foremost: fix your product.
你做的是产品生意——最优先级的事就是把产品做对。
If you're using a free trial, focus on getting the conversion rate for that right (ideally around 15–20%).
如果你有免费试用,先把试用转付费率做对(理想区间 15-20%)。
If this isn't right, your value proposition isn't resonating, or you may have a market where there is not enough pain to get people to buy.
如果这个数不对,说明价值主张没打动用户——或者市场上根本没有足够痛的需求。
Win/Loss ratio should be good.
Win/Loss 比应该健康。
Trial or Sales conversion rates on qualified leads should be good.
Qualified leads 的试用或销售转化率也应该健康。
Funnel metrics
1. Increase the number of raw leads coming in to the Top of your funnel.
2. Identify the profitable lead sources and invest in those as much as possible. Conversely stop investing in poor lead sources until they can be tweaked to make them profitable.
3. Increase the Conversion Rates at various stages in the funnel.
1. 增加进入漏斗顶端的原始 leads 数量。
2. 识别赚钱的渠道,在它们上面尽可能多投;反过来,停止往不赚钱的渠道砸钱——除非你能把它调到赚钱为止。
3. 提高漏斗各阶段的转化率。
Sales Metrics
Sales productivity (focus on getting this right consistently across a broad set of sales folks before hitting the gas).
销售产能——在一大批销售身上把这个数稳定做对之前,不要踩油门扩张。
Add Sales Capacity.
加销售产能。
But first make sure you know how to provide them with the right number of leads.
但要先确保你知道怎么给他们供应足量 leads。
This turns out to be one of the key levers that many companies rely on for growth.
这是很多公司增长所依赖的关键杠杆之一。
We have learned from experience how important it is to meet your targets for sales capacity by hiring on time, and hiring the right quality of sales people so there are fewer failures.
我们从经验里学到:产能目标的达成,关键在按时招人 + 招高质量的销售(失败率才低)。
Increase retention for your sales people.
提升销售自己的留存率。
Since you have invested a lot in making them fully productive, get the maximum return on that investment by keeping them longer.
你已经花了很多钱让他们达到完整产能——留得越久,你回报越大。
Look at adding Business Development Reps.
考虑加 BDR(Business Development Rep)。
These are outbound sales folks who specialize in prospecting to a targeted list of potential buyers.
他们是专做 outbound、面向潜在客户名单做开发的销售。
Pricing / Upsell / Cross-Sell
1. Multi-axis pricing.
2. Additional product modules (easier to sell more to existing customers than it is to sell to brand new customers).
1. 多维度定价(multi-axis pricing)。
2. 额外的产品模块——往存量客户身上加销比拓新客容易得多。
Turns out the pricing your product right can have a huge impact on the unit economics.
事实证明,把产品定价做对,可以对 unit economics 产生巨大影响。
Not simply by getting the average MRR right, or by providing upsell opportunities – but also by signaling what pieces of the product are most valuable.
不只是因为它影响平均 MRR,或提供了 upsell 机会——它还在告诉所有人"产品里哪一块最值钱"。
At HubSpot we changed our pricing in 2011 to be tiered based on the number of contacts in the system – and actually saw an increase in adoption of the contacts application after we made the change.
2011 年我们把 HubSpot 的定价改成按系统里的联系人数量分档——改完之后,我们的 contacts 应用使用率反而上升了。
This is counter-intuitive but makes sense given that we sell through an inside sales team.
这看似反直觉,但考虑到我们是通过电销团队销售的,就讲得通了。
After the pricing change, sales reps now could make a lot more money by selling the contacts.
定价改完之后,销售卖 contacts 能挣到的钱明显多了。
And they quickly become much better at positioning that part of the product, as well as finding companies with a contacts-based use case.
于是他们很快就把产品这一块定位讲得更好,也更擅长找到"以 contacts 为核心用法"的客户。
Product quality will remain paramount – but it's remarkable how much impact pricing, packaging and sales commission structure can have on product adoption and unit economics.
产品质量当然永远第一——但定价、打包方式、销售提成结构这三件事,对产品采用率和 unit economics 的影响之大,真的让人惊讶。
Customer Segmentation
Customer Segmentation analysis will help point out which are your most profitable segments. Two immediate actions that are suggested by this analysis are:
分层分析会告诉你哪一段最赚钱。基于这个分析的两个立刻能做的动作是:
1. Double down on your most profitable segments.
2. Look at your less profitable segments and consider changes that would make them more profitable: lower cost marketing & sales approaches, higher pricing, product changes, etc. If nothing seems to make sense, spend less effort on these segments.
1. 在最赚钱的分层上加倍下注。
2. 看不那么赚钱的分层,想想有没有办法让它们变得更赚钱:更便宜的市场和销售打法、更高的定价、产品改造等等。如果怎么搞都不合算,就少花精力在这一段。
International Markets
Expansion internationally is only recommended for fairly mature SaaS companies that already have honed their business practices in their primary market.
国际化扩张,只建议那些已经在主市场把生意打磨好的、比较成熟的 SaaS 公司去做。
It is far harder to experiment and tune a business in far off regions, with language and cultural differences.
在遥远的地区——有语言和文化差异——尝试和调优一家公司,难度要大得多。
One of the biggest challenges we face is the trade-off between growth and unit economics (specifically churn).
我们面临的最大挑战之一,是增长和 unit economics(特别是流失)之间的权衡。
Many of the things that we have done to reduce churn have (potentially) come at the expense of lowering our growth rate.
我们为降流失做的很多事情,(潜在地)都以拉低增长率为代价。
Those have been some of our hardest decisions: e.g. requiring upfront payments, requiring customers buy consulting, holding sales reps accountable for churn, etc.
那些是我们做过最艰难的决定——比如要求预付、要求客户购买咨询服务、让销售为流失负责,等等。
We are always looking at things that give us growth without the tradeoff of lower growth.
我们一直在找那些"能带来增长而不需要权衡损失增长"的东西。
For example product improvement is an obvious one – a better product is easier to sell and provides more value to the customer.
比如产品改进就是一个显而易见的选项——更好的产品更好卖,也给客户更大价值。
Services promotions actually work well too.
服务促销其实也挺有效。
Many of the options that SaaS companies have to adjust their business are not simply a win-win but are still worth exploring.
SaaS 公司能用来调整生意的选项,很多不是简单的双赢——但仍然值得探索。
Too many companies think that every problem is a product problem and every solution is that the product must get better.
太多公司认为所有问题都是产品问题,所有解法都是"产品得变得更好"。
The other thing that's really important is that companies don't try to spin these numbers.
另一件非常重要的事:公司不要试图粉饰这些数字。
There is so much pressure to dismiss a bad customer (who hurt your churn number) or exclude costs (only count marketing 'program' spend – not headcount).
压力总是很大——比如让你把某个"坏客户"剔除(因为他拉高了流失数),或者排除某些成本(只算市场的"项目"开支、不算 headcount)。
If you can get the accounting close enough to right it actually frees management from needing to make every decision.
如果你能把这套核算做到足够接近正确,反过来管理层就不需要事事亲为做每一个决策。
If the accounting is right management can obsess over setting goals (growth, LTV:CAC), hold people accountable to those goals and then give autonomy to their team on how to achieve those goals.
核算对了,管理层就可以专心定目标(增长、LTV:CAC),让团队为这些目标负责,然后把"怎么达成"的自主权交给团队。
Plan ahead
It takes time for most initiatives to have an impact.
大多数动作要起效都需要时间。
We've learned from some tough lessons that planning has to be done well in advance to drive a SaaS business.
几次惨痛教训让我们学到:跑 SaaS 公司必须提前很久就开始规划。
For example if you are not happy with your current growth rate, it will often take nine to twelve months from the point of decision before the growth resulting from increased investment in sales and marketing will actually be observed.
比如,如果你对当前增长率不满意,从决定加大销售和市场投入,到实际观察到增长起效,通常要 9 到 12 个月。
The High Level Picture: How to Run a SaaS Business
Hopefully what you will have gathered from the discussion above is that there are really three things that really matter when running a SaaS business:
希望读完上面这些讨论你已经感受到:跑 SaaS 公司,真正重要的就三件事:
1) Acquiring customers
2) Retaining customers
3) Monetizing your customers
1)获取客户 2)留住客户 3)持续变现
The second item should be first on your list of things to get right.
第二件事——留住客户——应该在你的"要做对的事"清单里排第一。
If you can't keep your customers happy, and keep them using the service, there is no point in worrying acquiring more of them.
你要是没法让客户开心、让他们持续用服务,担心怎么"拉更多客户"毫无意义。
You will simply be filling a leaky bucket.
你只是在给漏底的桶加水。
Rather focus your attention on plugging the leaks.
把注意力先放在堵漏上。
SaaS businesses are remarkably influenced by a few key numbers.
SaaS 公司被几个关键数字深刻地影响着。
Making small improvements to those numbers can dramatically improve the overall health of the business.
对这些数字做小幅改善,就能显著提升整家公司的健康度。
Once you know your SaaS business is viable using the guidelines provided for LTV:CAC, and Time to recover CAC, hit the accelerator pedal.
一旦你用 LTV:CAC 和 CAC 回收期这两条法则确认了生意可行,就踩下油门。
But be prepared to raise the cash needed to fund the growth.
但要做好融够钱来支撑这轮增长的准备。
Although this article is long and occasionally complex, we hope that it has helped provide you with an understanding of which metrics are key, and how you can go about improving them.
这篇文章很长,有些地方也比较复杂——希望它能让你搞清楚哪些指标是关键、以及怎么去改善它们。
For more discussion on SaaS metrics and benchmarks, click here: Demystifying Churn: Measuring and Benchmarking this Metric.
想看更多关于 SaaS 指标和基准的讨论:Demystifying Churn: Measuring and Benchmarking this Metric。
Acknowledgements
I would like to thank Ron Gill, the CFO of NetSuite, and Brad Coffey & Brian Halligan of Hubspot for their help in writing this.
我要感谢 NetSuite 的 CFO Ron Gill,以及 HubSpot 的 Brad Coffey 和 Brian Halligan——他们对这篇文章的撰写提供了大量帮助。
I would like to thank the HubSpot management team without whom none of this would be possible.
我要感谢 HubSpot 整个管理团队——没有他们,这一切都不会发生。
Most of my learnings on SaaS have come from working with them.
我关于 SaaS 的大部分认知,来自跟他们一起工作的过程。
I would also like to thank Gail Goodman, the CEO of Constant Contact who also taught us many of the key metrics in her role as board member of HubSpot.
我还要感谢 Gail Goodman——Constant Contact 的 CEO,她以 HubSpot 董事的身份教给了我们许多关键指标的用法。